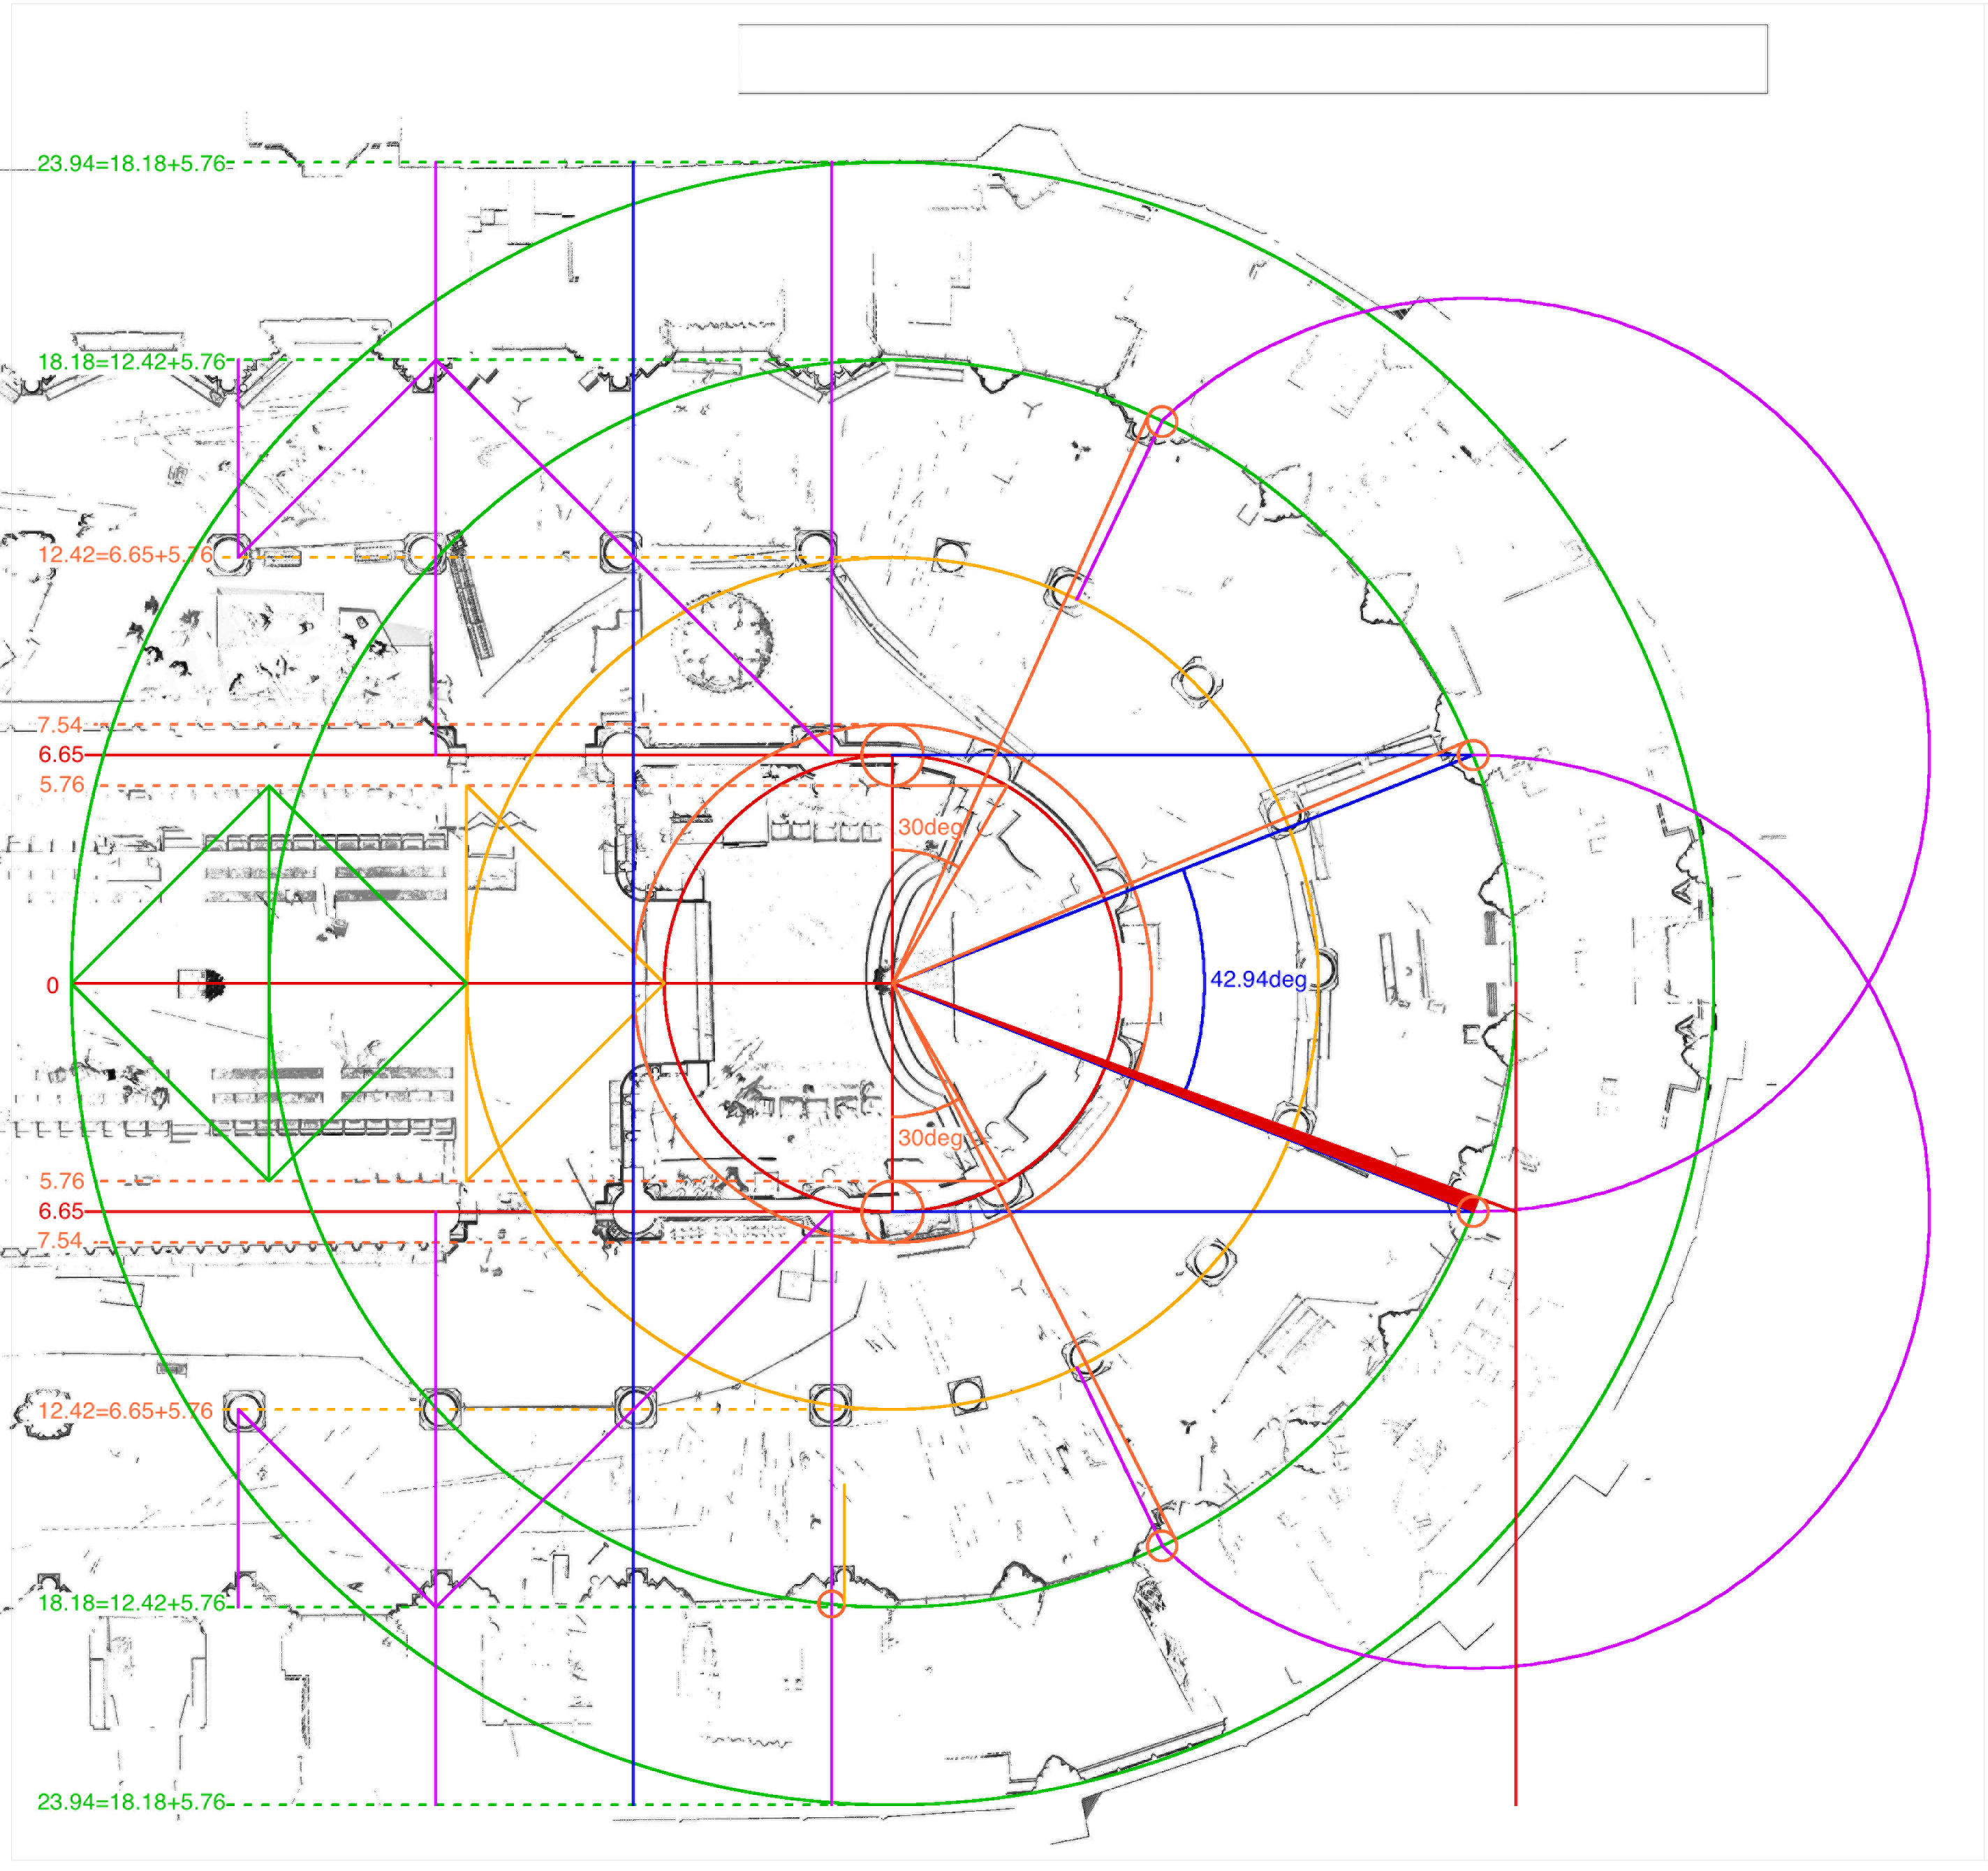
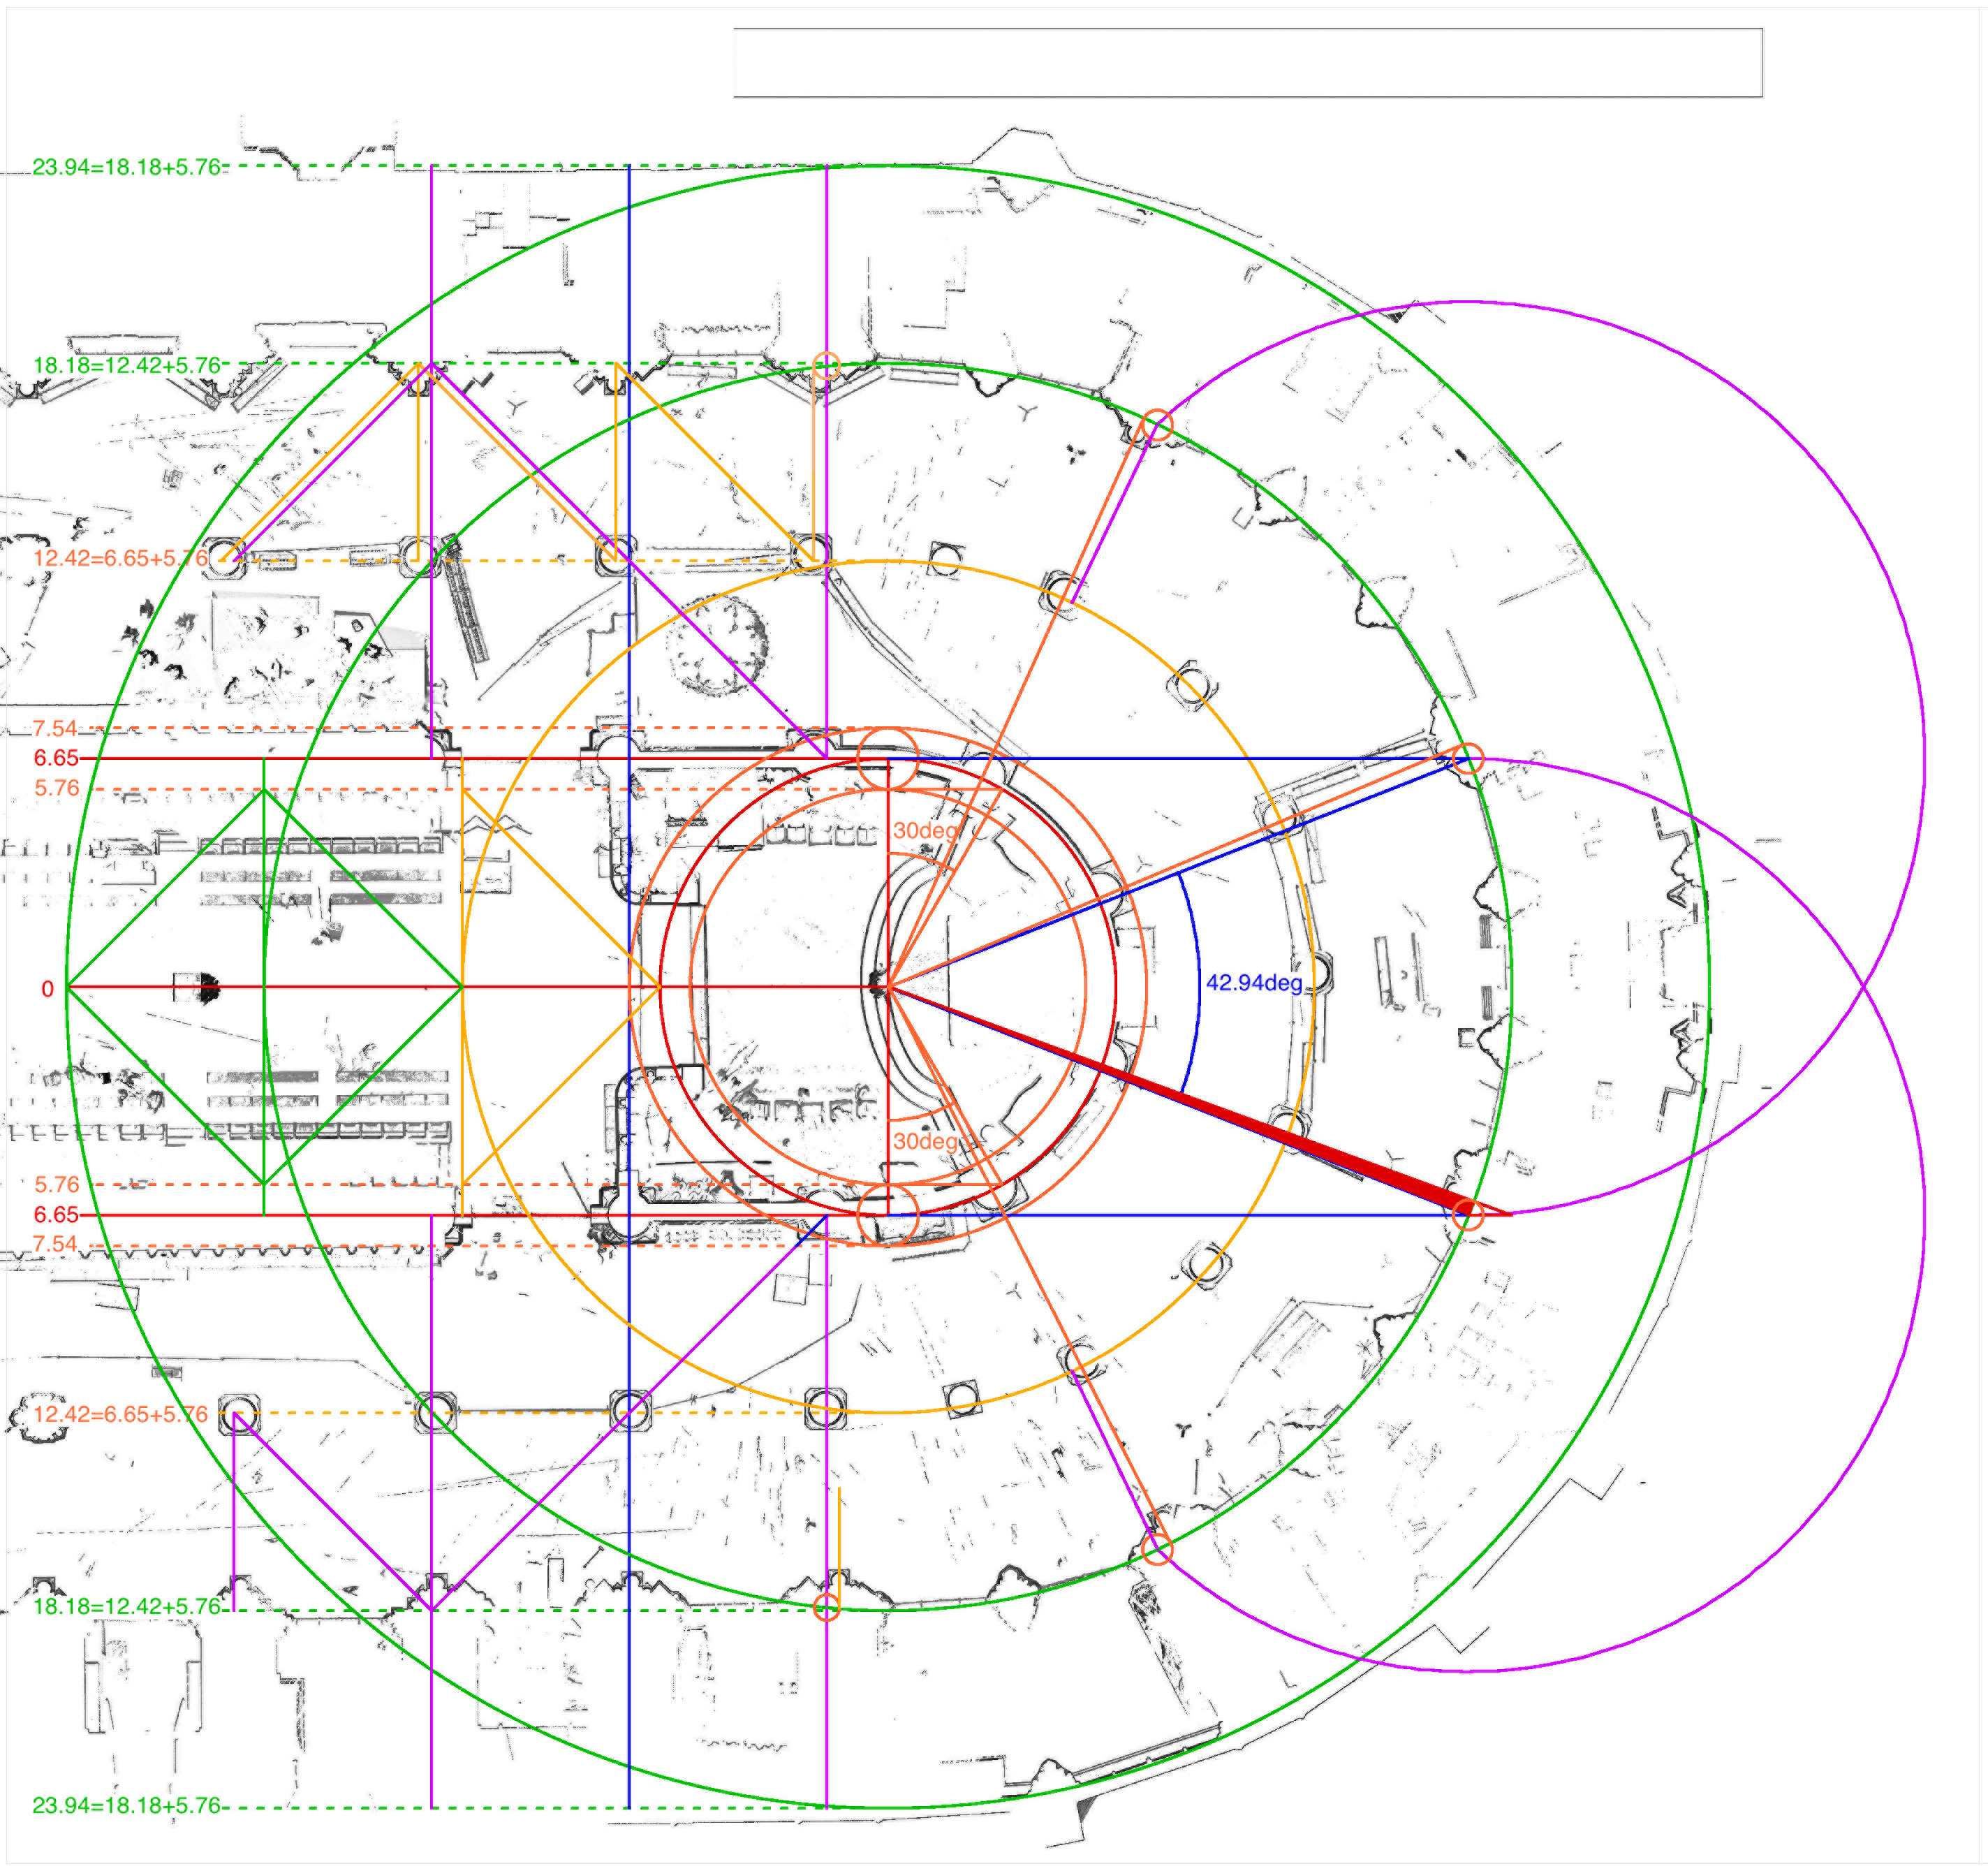
The Chevet Plan at Notre-Dame in Paris: A Geometrical Analysis

See related article: Bork, R 2014 Dynamic Unfolding and the Conventions of Procedure: Geometric Proportioning Strategies in Gothic Architectural Design. Architectural Histories, 2(1): 14, pp. 1-20, DOI: http://dx.doi.org/10.5334/ah.bq
How to cite this supplement: Bork, R 2014 Dynamic Unfolding and the Conventions of Procedure: Geometric Proportioning Strategies in Gothic Architectural Design. Architectural Histories, 2(1): 14, Supplement 1, DOI: http://dx.doi.org/10.5334/ah.bq.s1

Until recently, a variety of technical challenges have made it difficult to undertake really reliable geometrical analyses of medieval church design. Collecting precise measurements of the buildings in question has been labor intensive even in the best of circumstances, and errors can readily creep into the reconstruction of plans and elevations based on those measurements. Human error can also affect the way that trial lines are drawn on the resulting documents, and the limited precision of traditional drawing media has stymied attempts to test geometrical hypotheses with real rigor.

To get around these problems, I have spent the past decade using a Computer-Aided-Design (CAD) system to analyze original medieval architectural drawings. These documents can be measured far more readily than the buildings themselves, and their study can offer a remarkably intimate perspective on the working methods of the draftsmen who produced them, as I demonstrate at length in my 2011 book “The Geometry of Creation.” However, while hundreds of original medieval design drawings survive, almost all of them come from the German late Gothic world. Comparable drawings were almost certainly used already in the twelfth century, when the Gothic style first emerged in France, but none of these has been preserved. Geometrical analysis of early Gothic architecture must thus depend on careful measurement of the buildings themselves. The development of photogrammetric and laser-based survey techniques, fortunately, has begun to revolutionize the collection of such data.

The present short study of Notre-Dame in Paris shows how CAD can fruitfully be used to study the amazingly precise data gleaned from laser surveys of Gothic buildings. I am grateful to Professor Andrew Tallon of Vassar College, who has emerged as a leader in the field, for kindly allowing me to use his survey results as the basis for my investigation. His survey methods, and my techniques of CAD-based geometrical study, are sketched in our respective contributions to the issue of “Architectural Histories” that emerged from the 2011 Leiden conference on architectural proportion.

One of the great advantages of computer-based laser surveying technology is that it allows the construction of a genuinely three-dimensional model of the building in question, since the computer describes the building as a cloud of points with precisely measured locations in space. Gothic builders, however, conceived their buildings using simple two-dimensional drawings, usually starting by developing the ground plan. In analyzing the design of Notre-Dame, therefore, it is convenient to begin by studying only the subset of points measured near ground level.
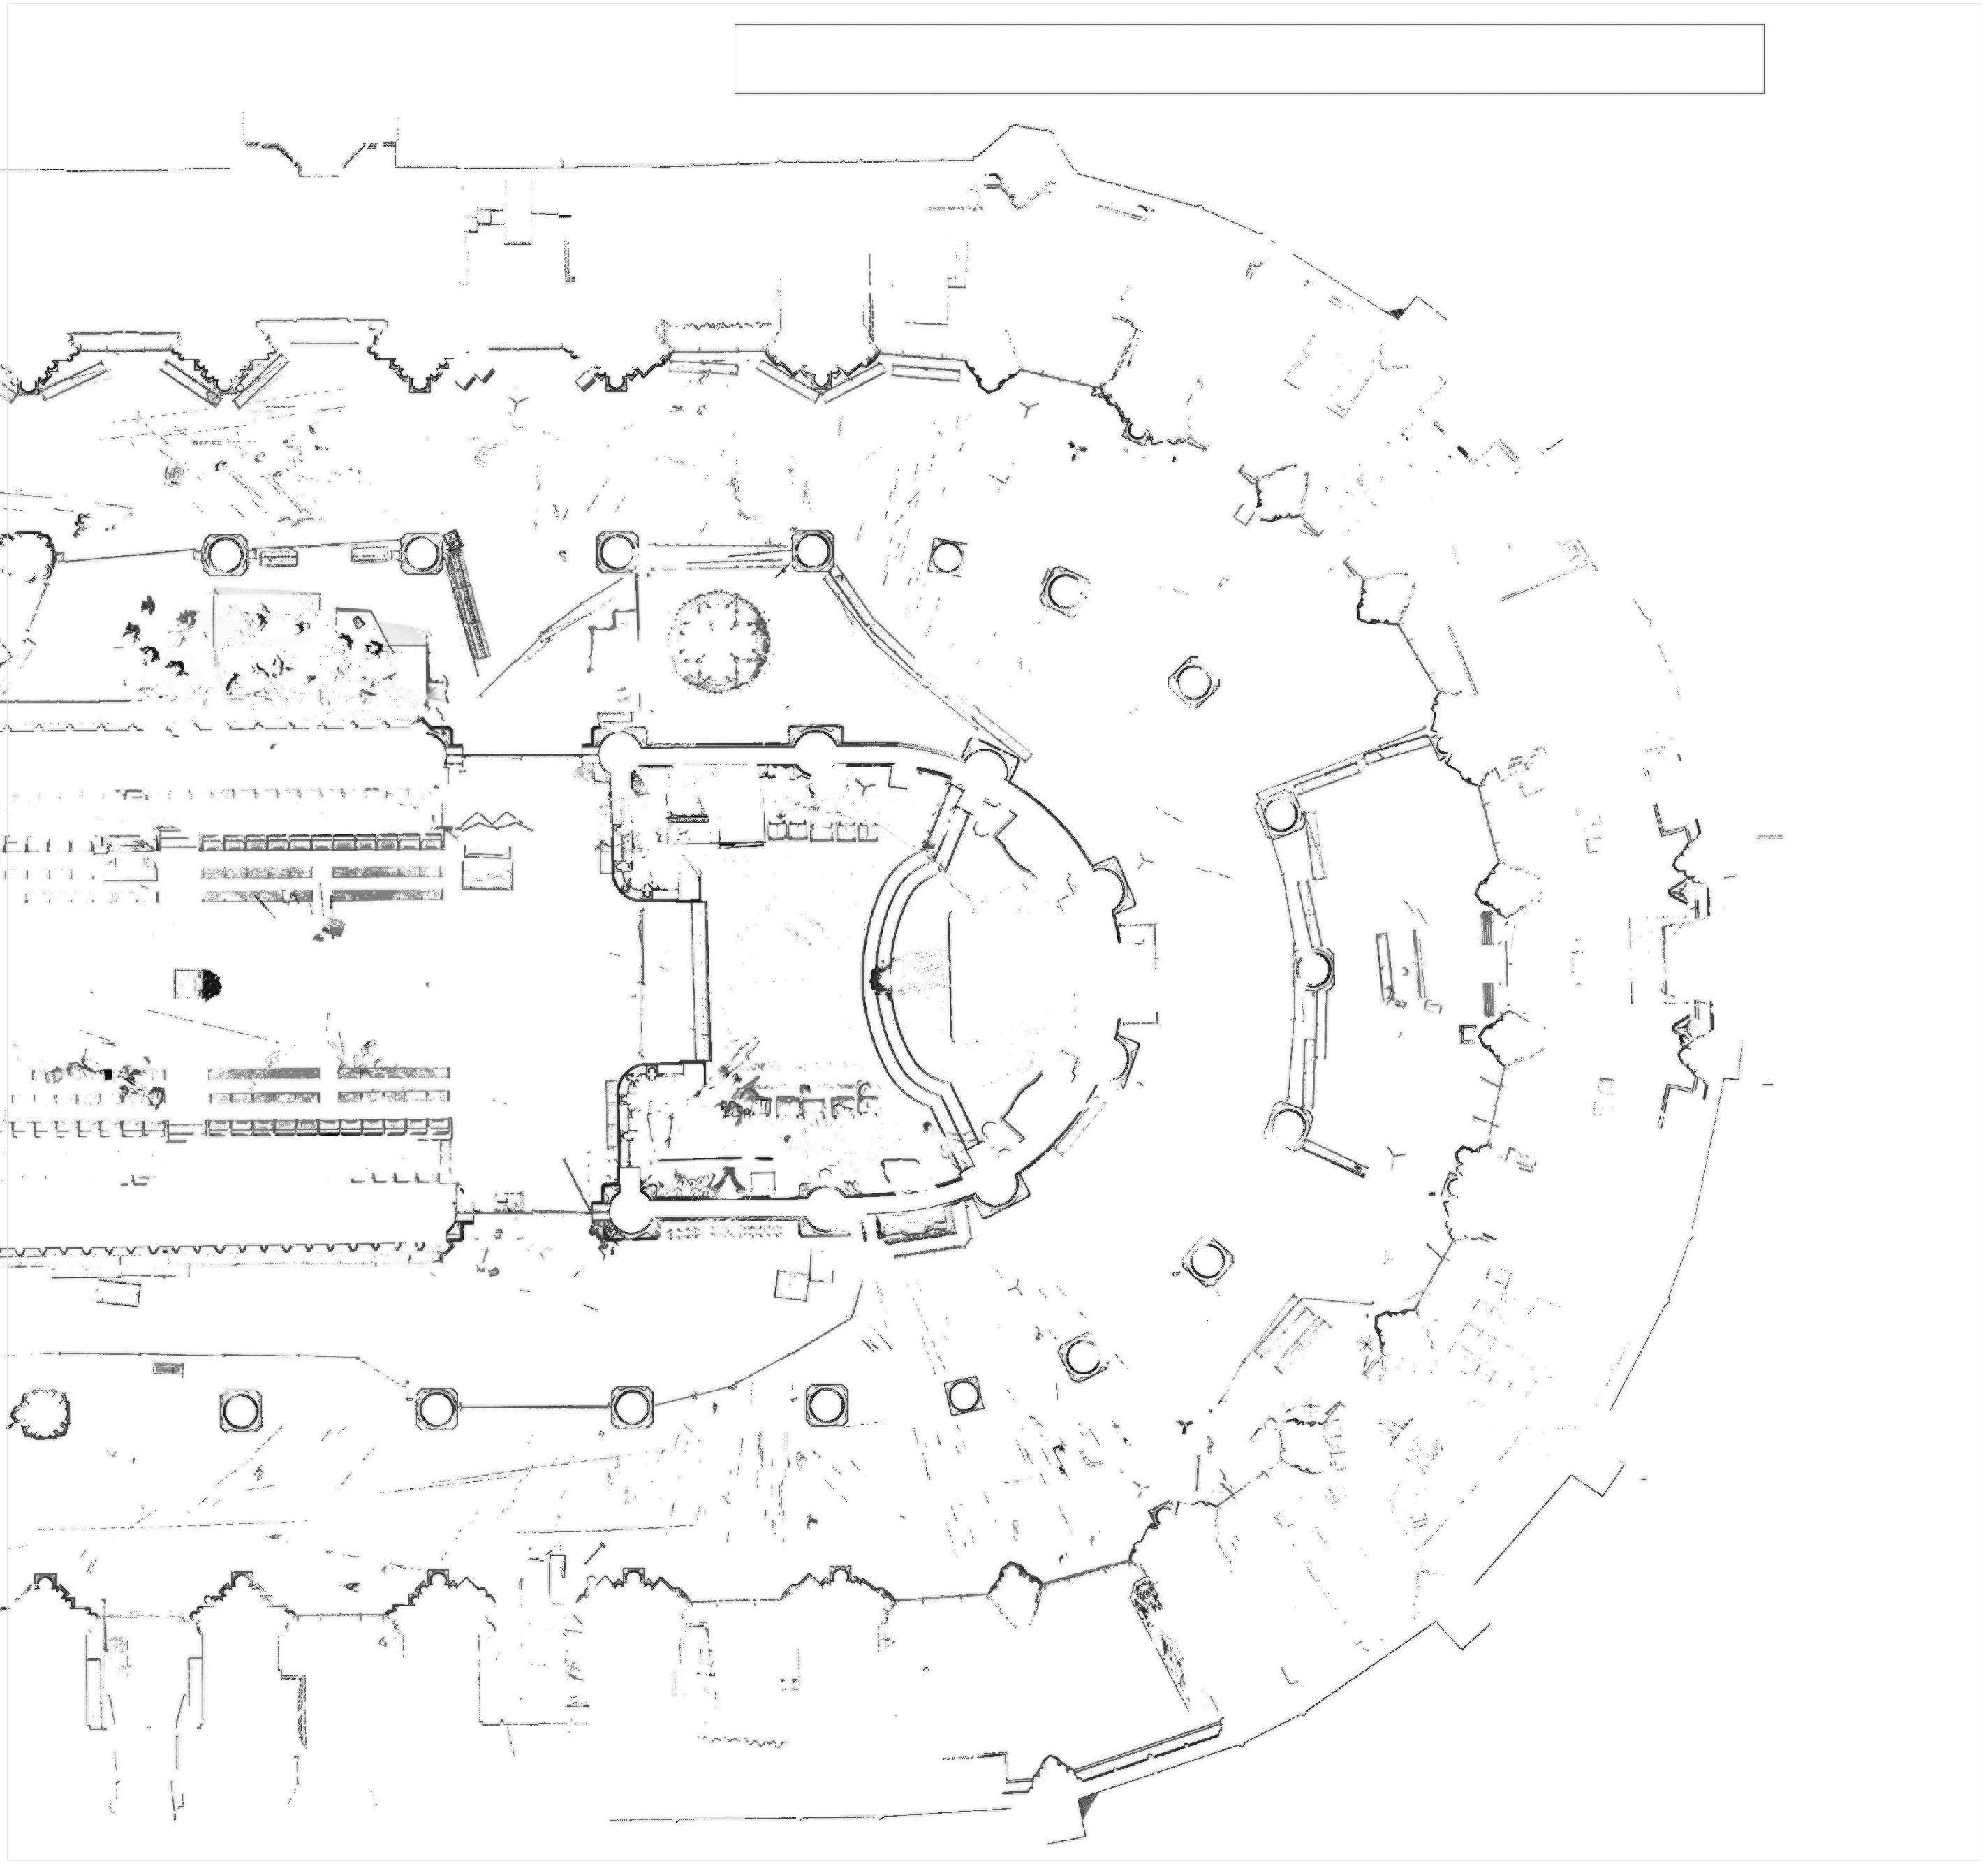
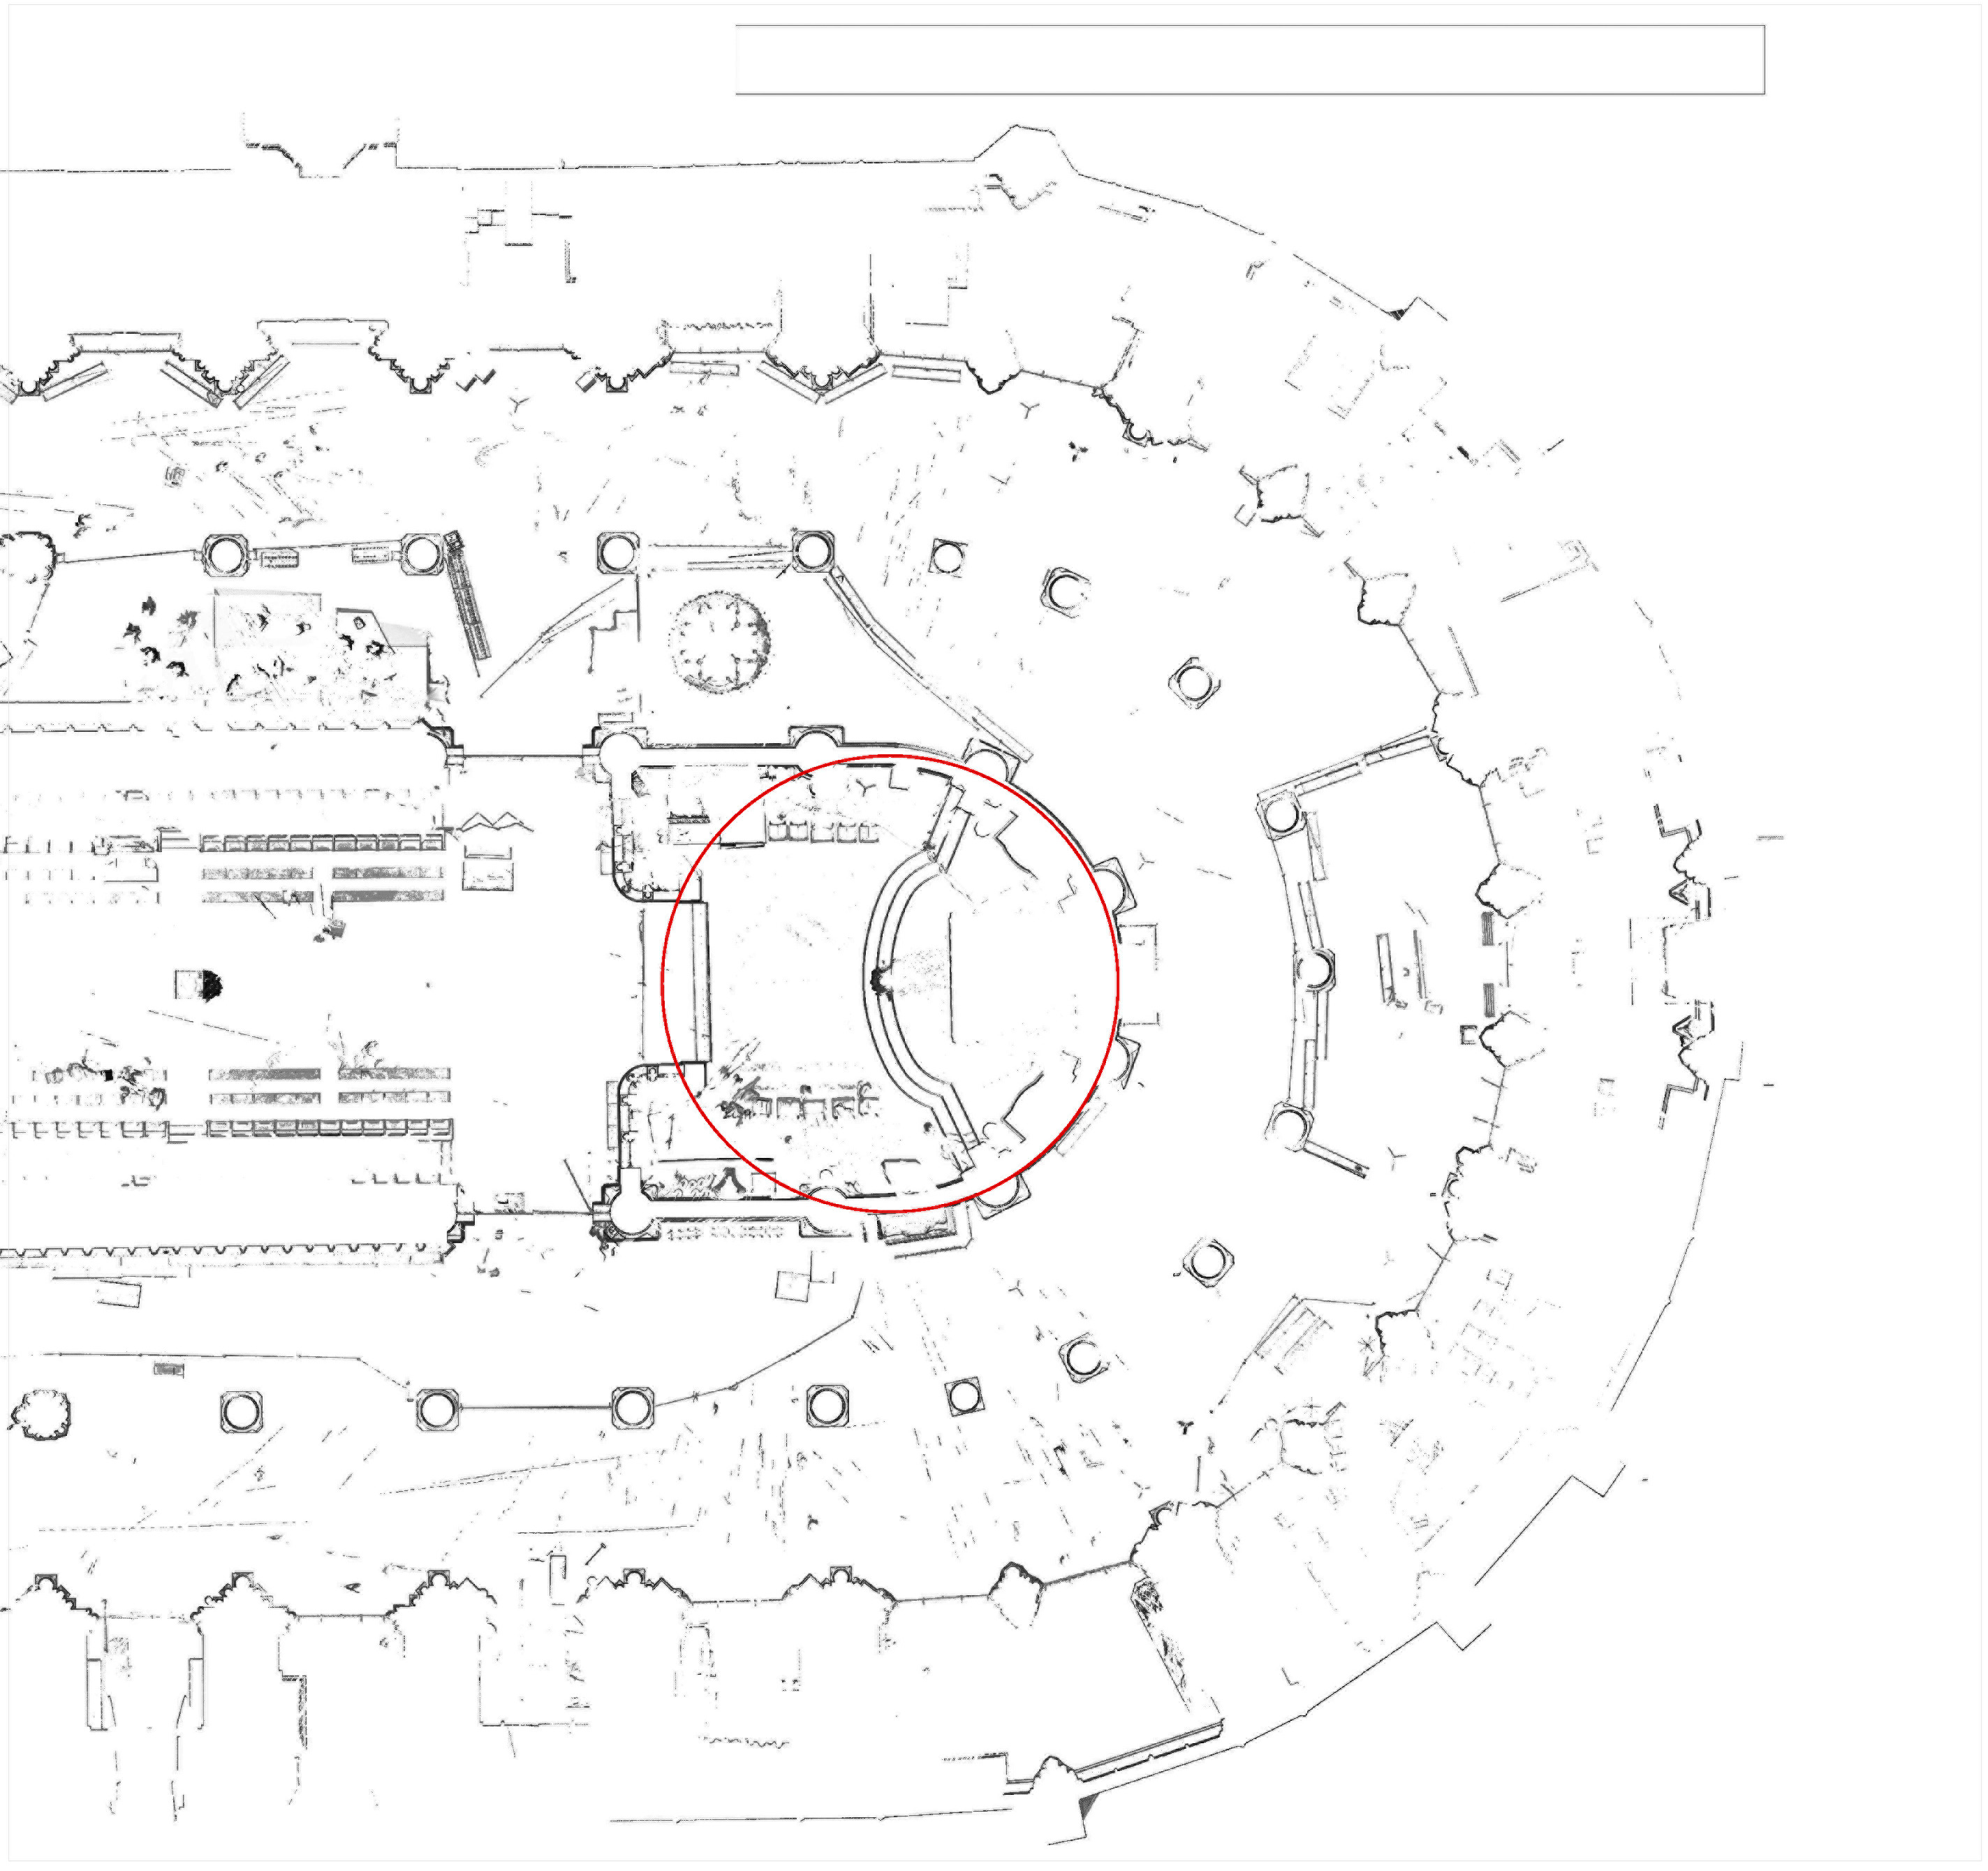
Partial plan of Notre-Dame in Paris, showing eastern portion of cathedral according to laser scan data by Andrew Tallon.

This figure shows the plan of the east end of Notre-Dame in Paris, based on Tallon’s laser survey. This plan shows the location of hundreds of thousands of points measured near ground level; the millions of points that describe the vaults and superstructure of the building have here been cut away from the point cloud for the sake of clarity, so as to leave a viably legible two-dimensional image. Because the laser scanner functions automatically, taking data indiscriminately about all the surfaces its beam encounters, the figure shows not only architectural elements, but also details such as the location of individual choir stall seats and even the placement of benches and other portable furnishings. Conversely, though, some nooks and crannies that were not directly scanned by the laser do not show up, and the image as a whole has a rather ghostly quality, because it makes no distinction between solids and voids. Before going on to show how dynamically unfolding geometrical figures can explain even minute details of the laser-scanned data, therefore, it may be helpful to briefly examine a less precise but more readily legible schematic plan of Notre-Dame.

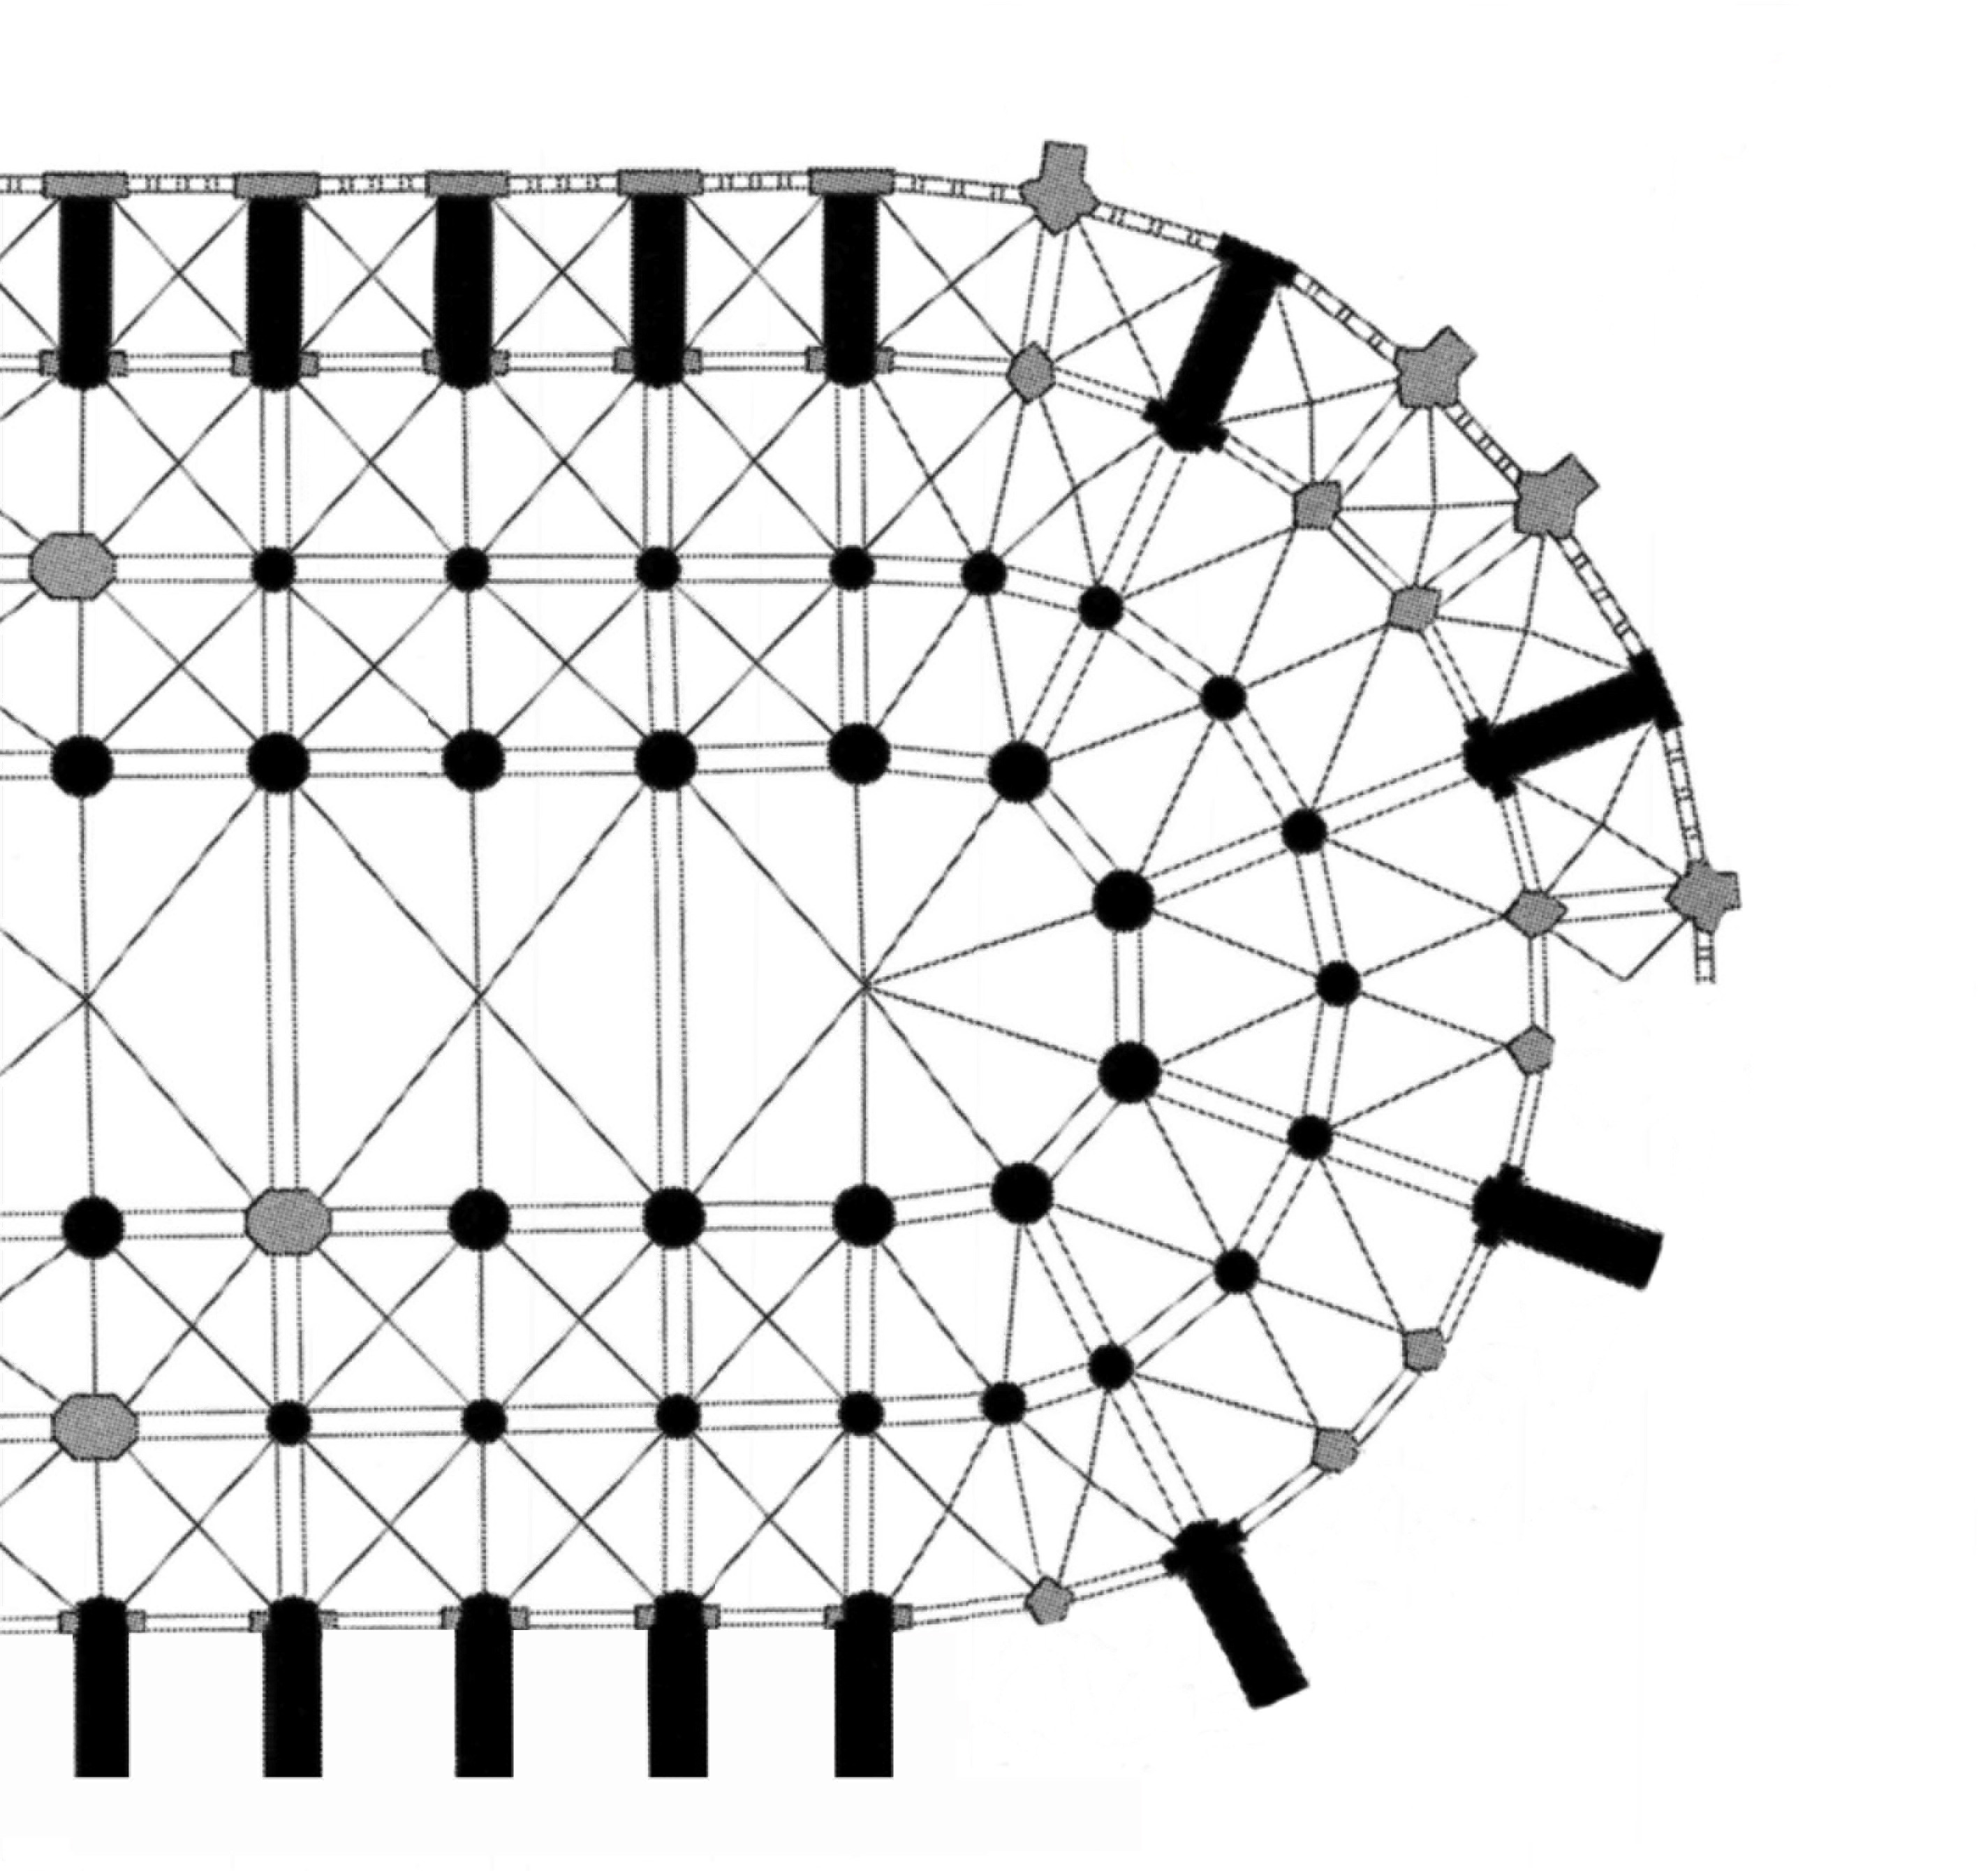
Partial schematic plan of Notre-Dame in Paris, showing contrast between original plan of east end (below) and current plan (above).

The bottom half of this figure shows the original format of the cathedral’s east end, with the main choir vessel wrapped by double ambulatories and boldly salient buttresses. As the top half of the image shows, chapels were later added between the buttresses, forming a third belt of interior space around the main vessel. All three of these belts have the same depth, which is slightly less than the half-span of the choir. That may seem unremarkable, but the ratio between these dimensions demands to be explained. The radial subdivisions of the east end are more obviously puzzling, since the exterior wall is not subdivided into five equal slices, despite the five-fold subdivision of the hemicycle. Instead, the wedges flanking the straight bays are narrower than the three in the middle, corresponding to two bay divisions in the outer wall rather than three. The differences between these bays, in fact, are even more pronounced than they appear in this rather schematic plan, and the real fabric of the building includes a number of asymmetries between north and south that are not seen in this simplified figure. As it turns out, however, all of these features can be readily explained in terms of a simple sequence of geometrical operations.

Image source: Dehio and von Bezold (1887) Die kirchliche Baukunst des Abendlandes

Partial plan of Notre-Dame in Paris, according to laser scan data by Andrew Tallon, showing circular construction of hemicycle.

This figure shows the likely first step in the layout of Notre-Dame, namely, the establishment of the hemicycle. The centers of the four eastern hemicycle columns stand on the circle shown here in red.

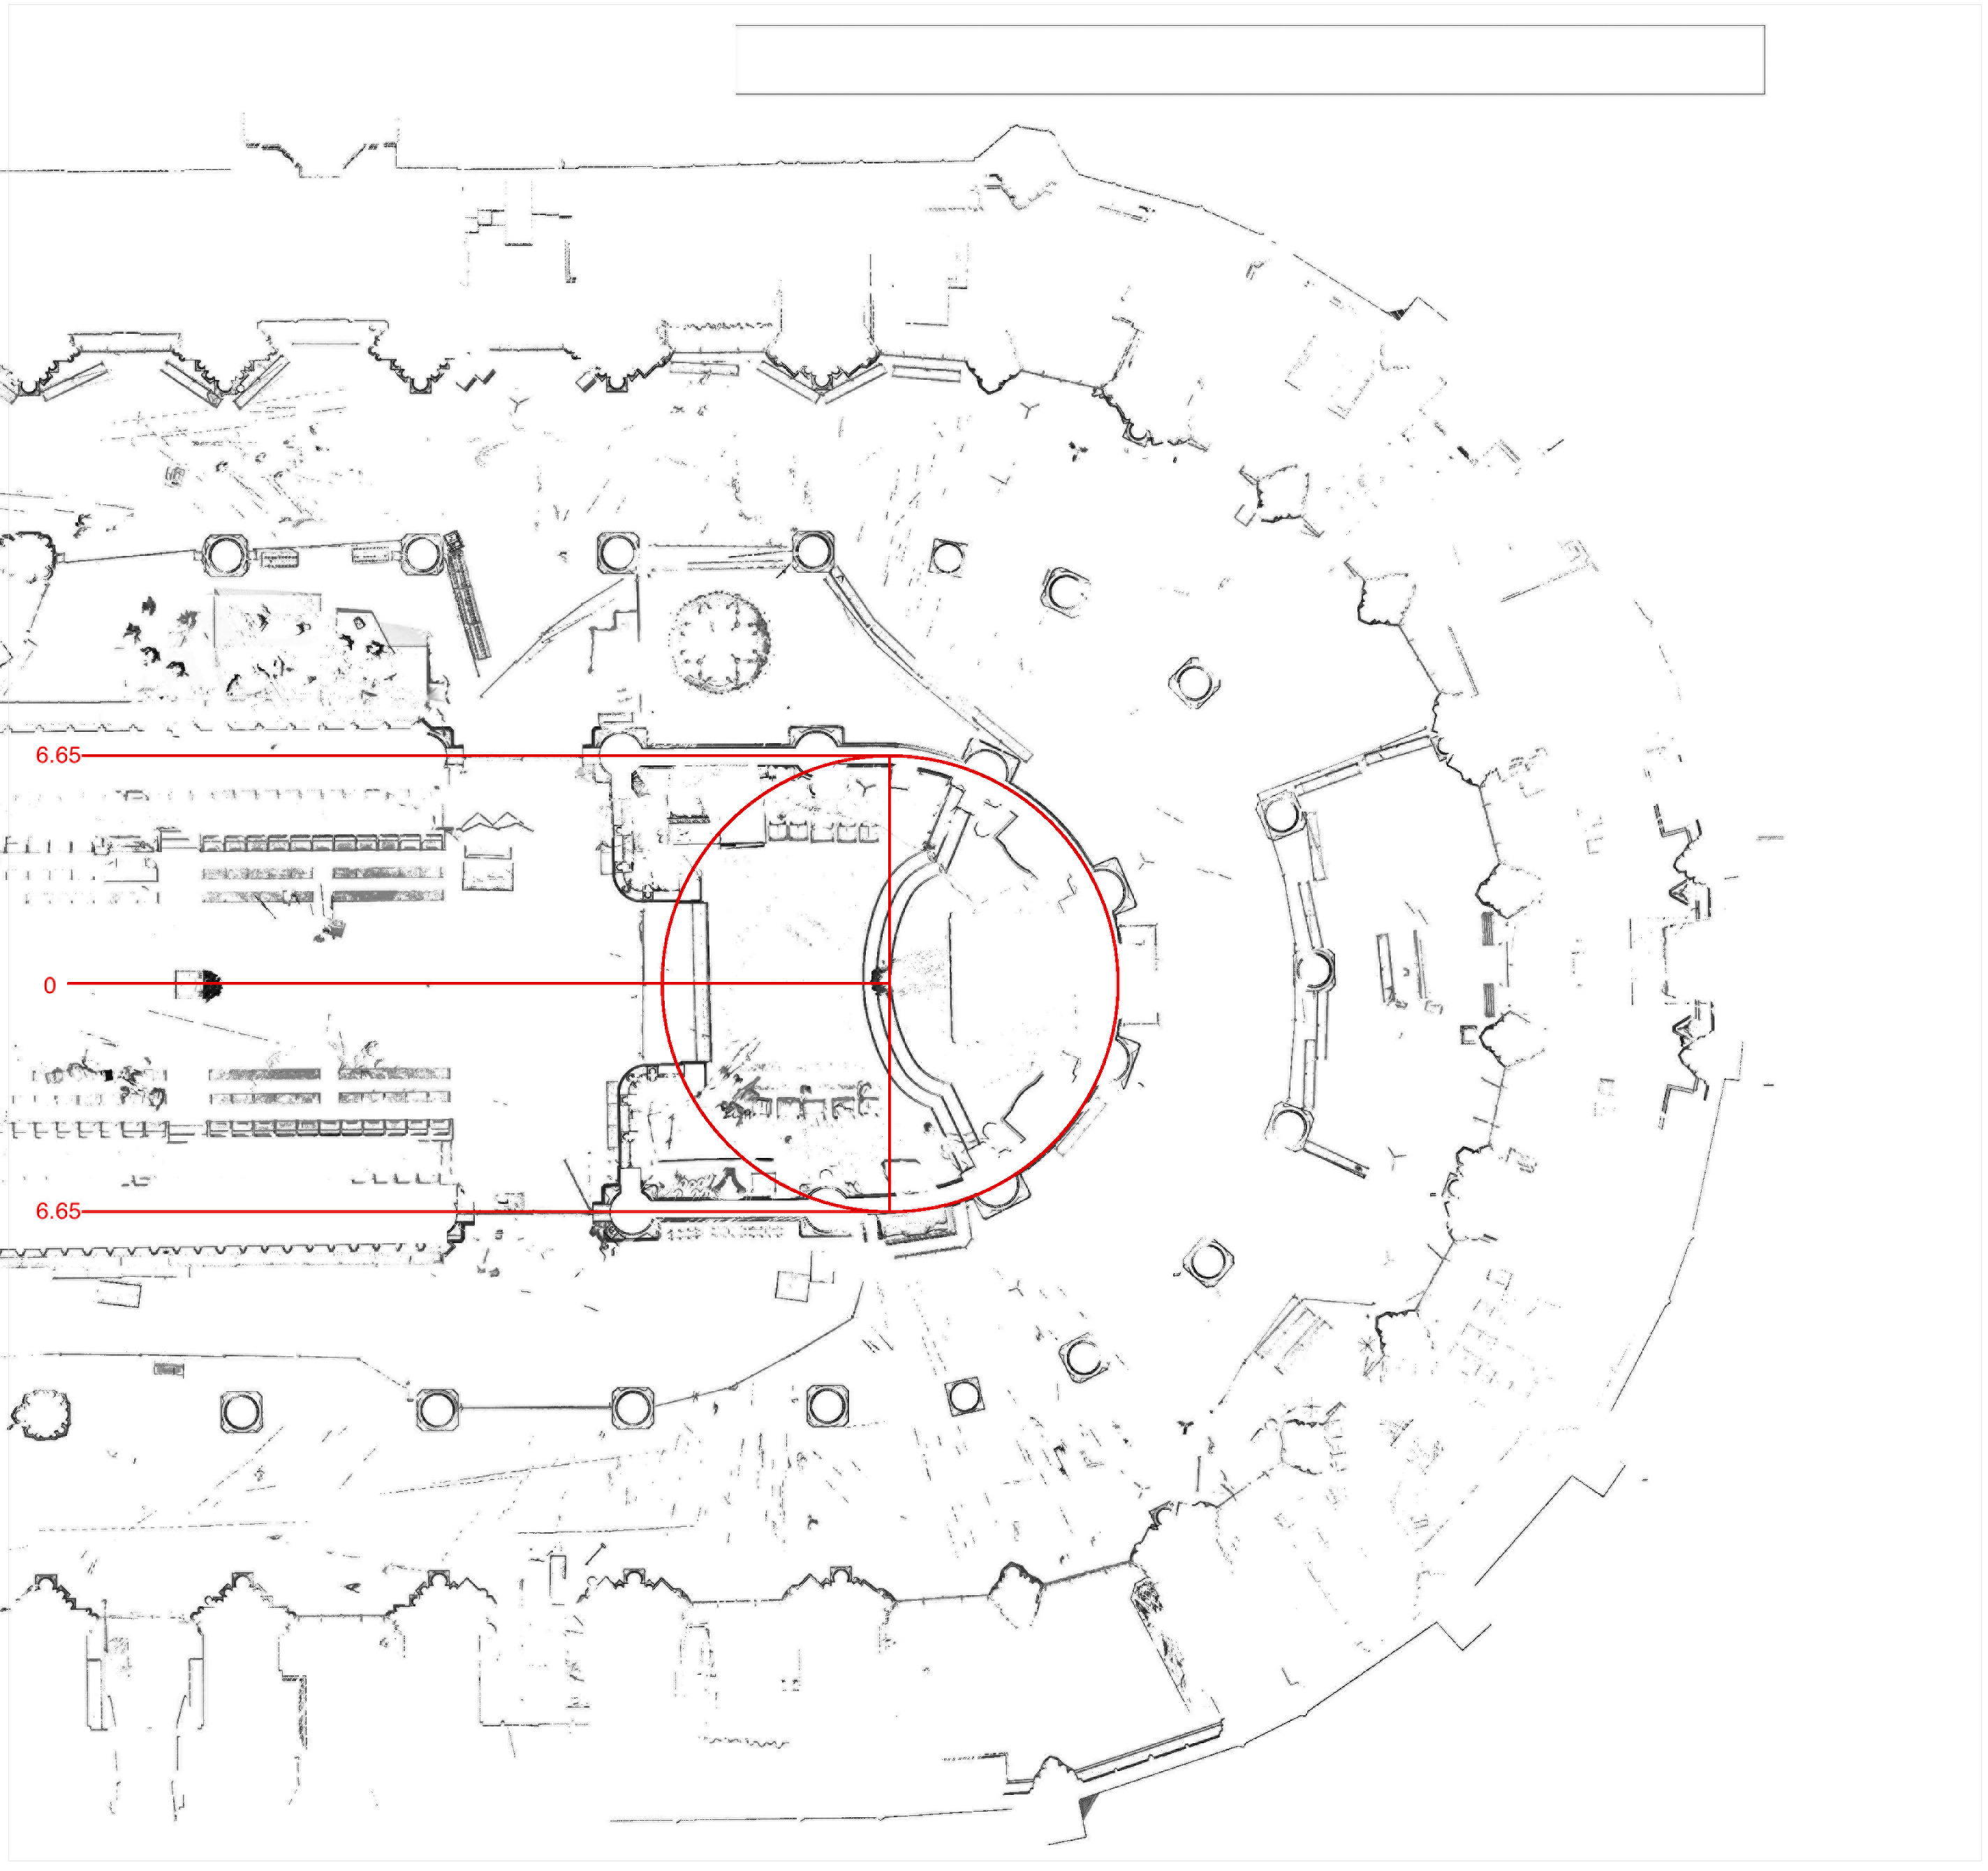
Partial plan of Notre-Dame in Paris, according to laser scan data by Andrew Tallon, showing construction of main arcade axes based on hemicycle circle.

Tangents to this circle define the axes of the arcade piers, which lie 6.65 meters from the building centerline.

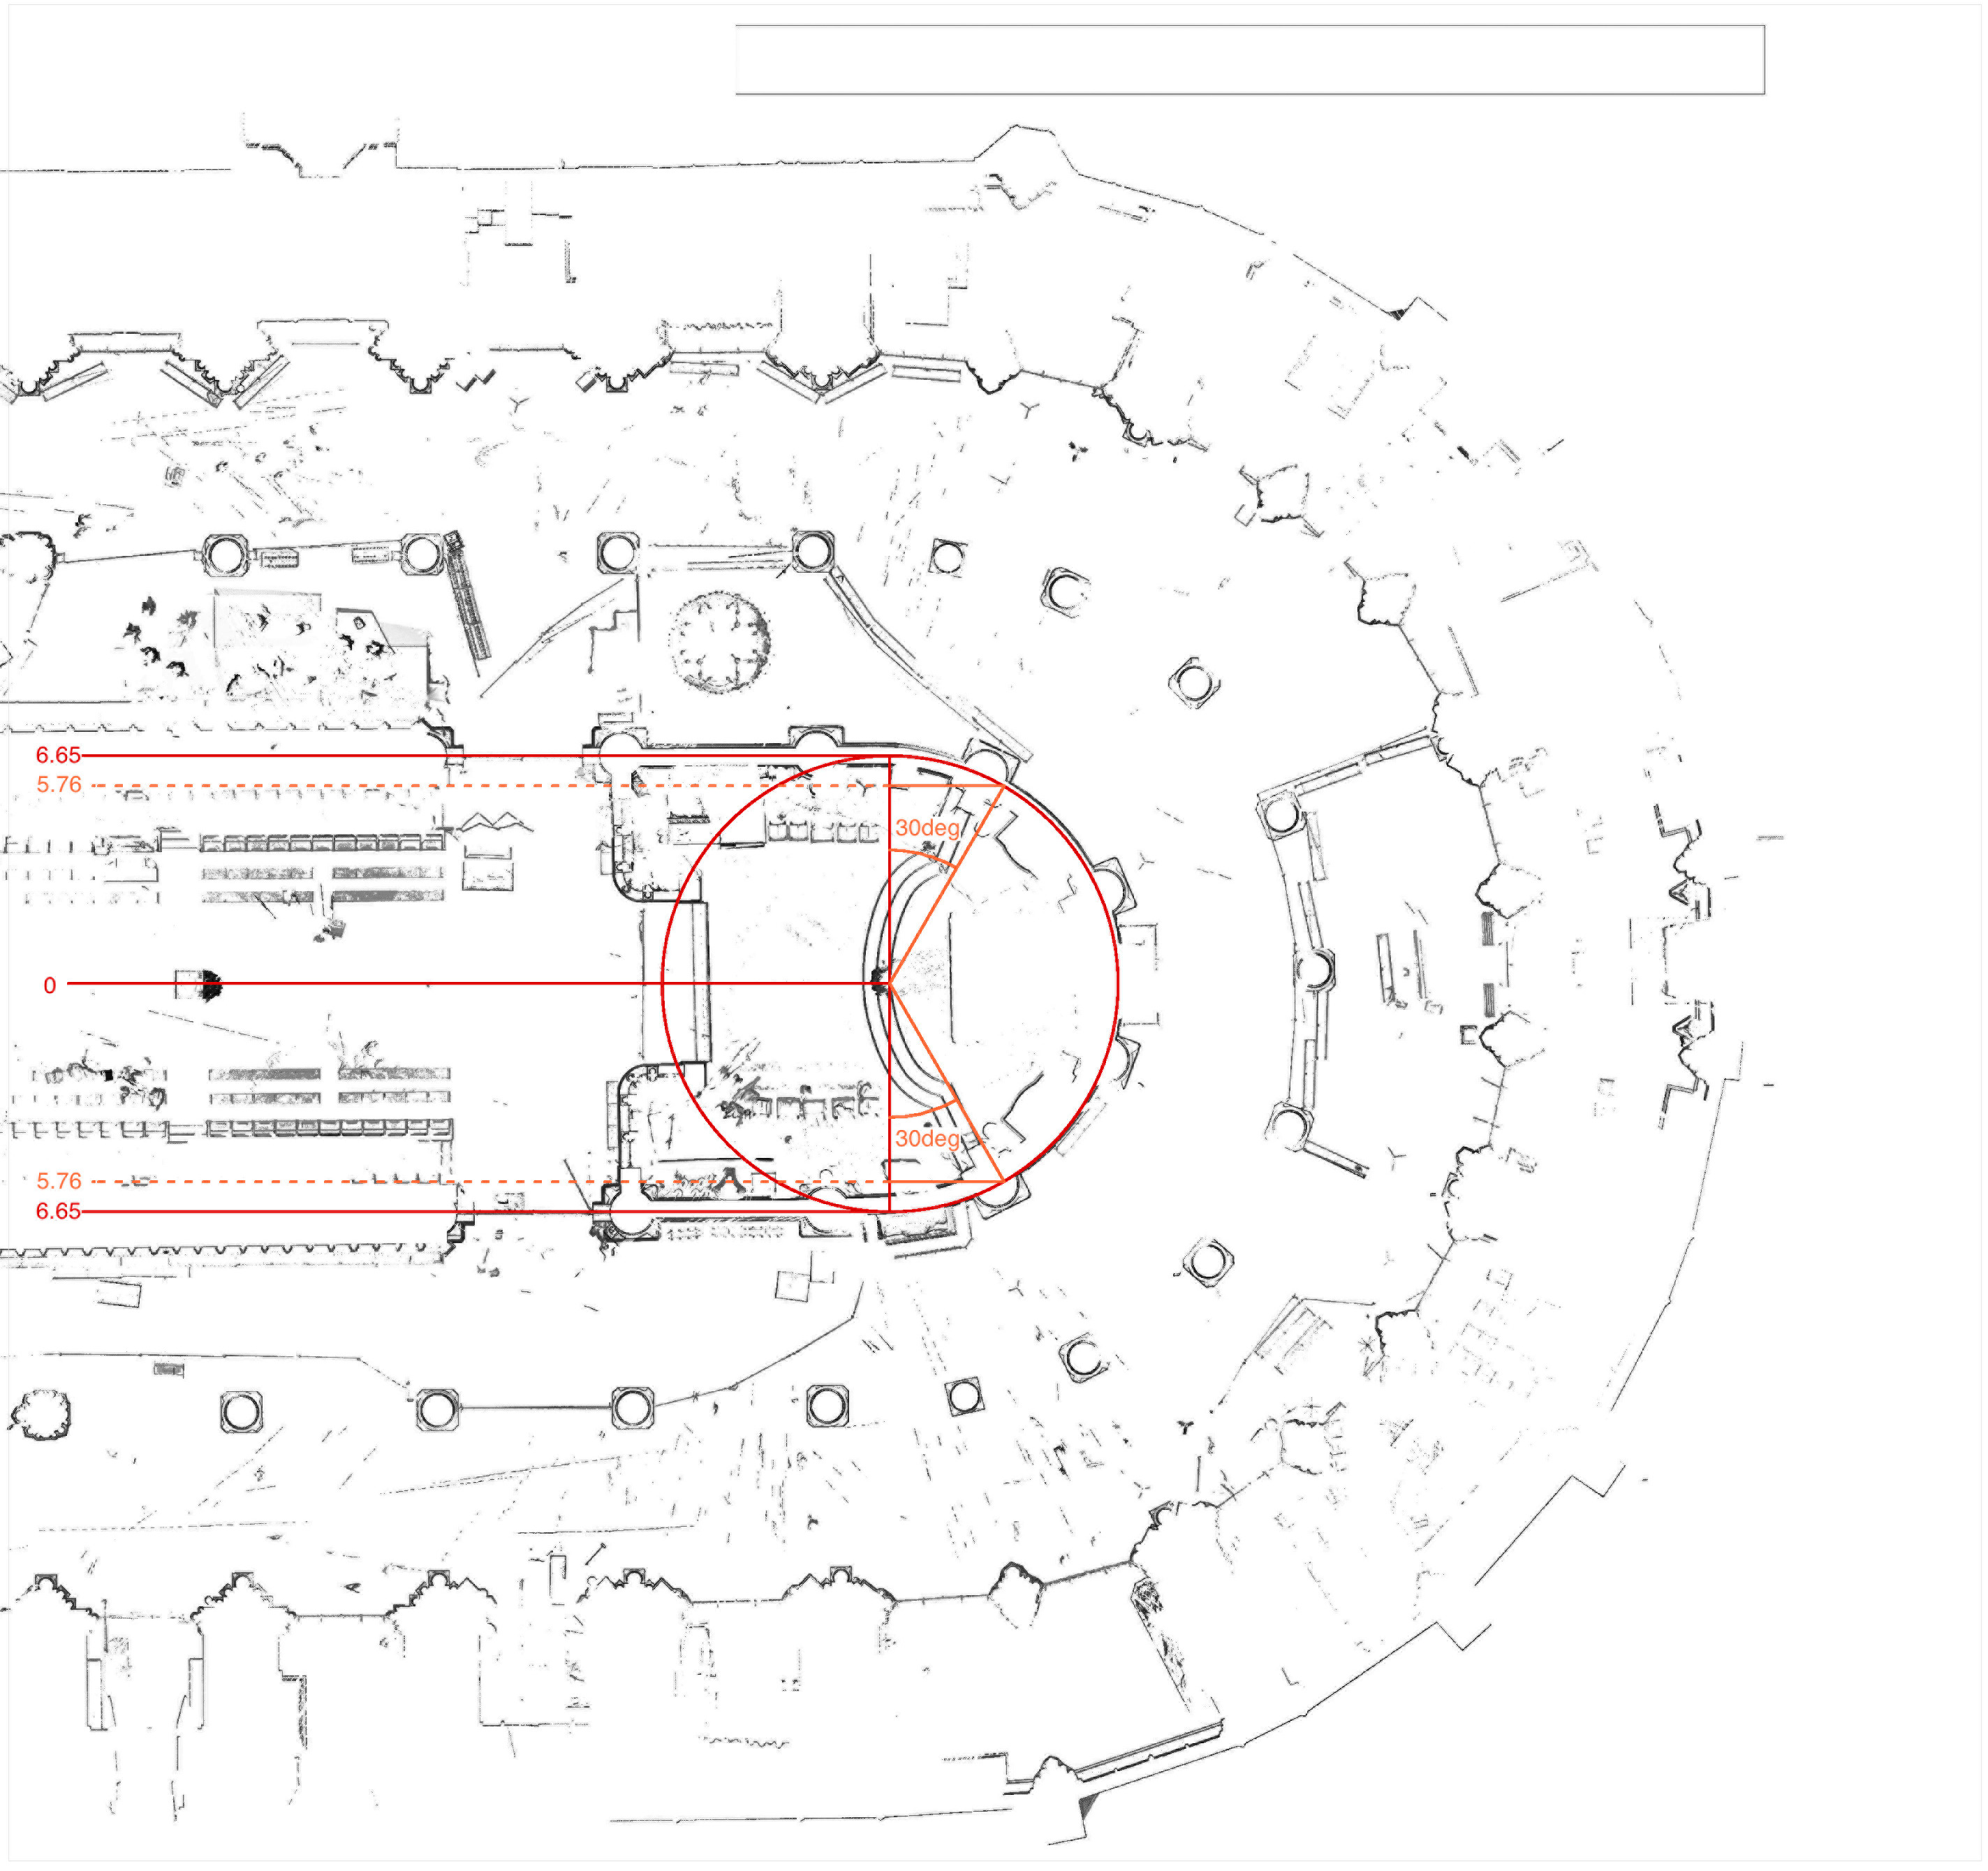
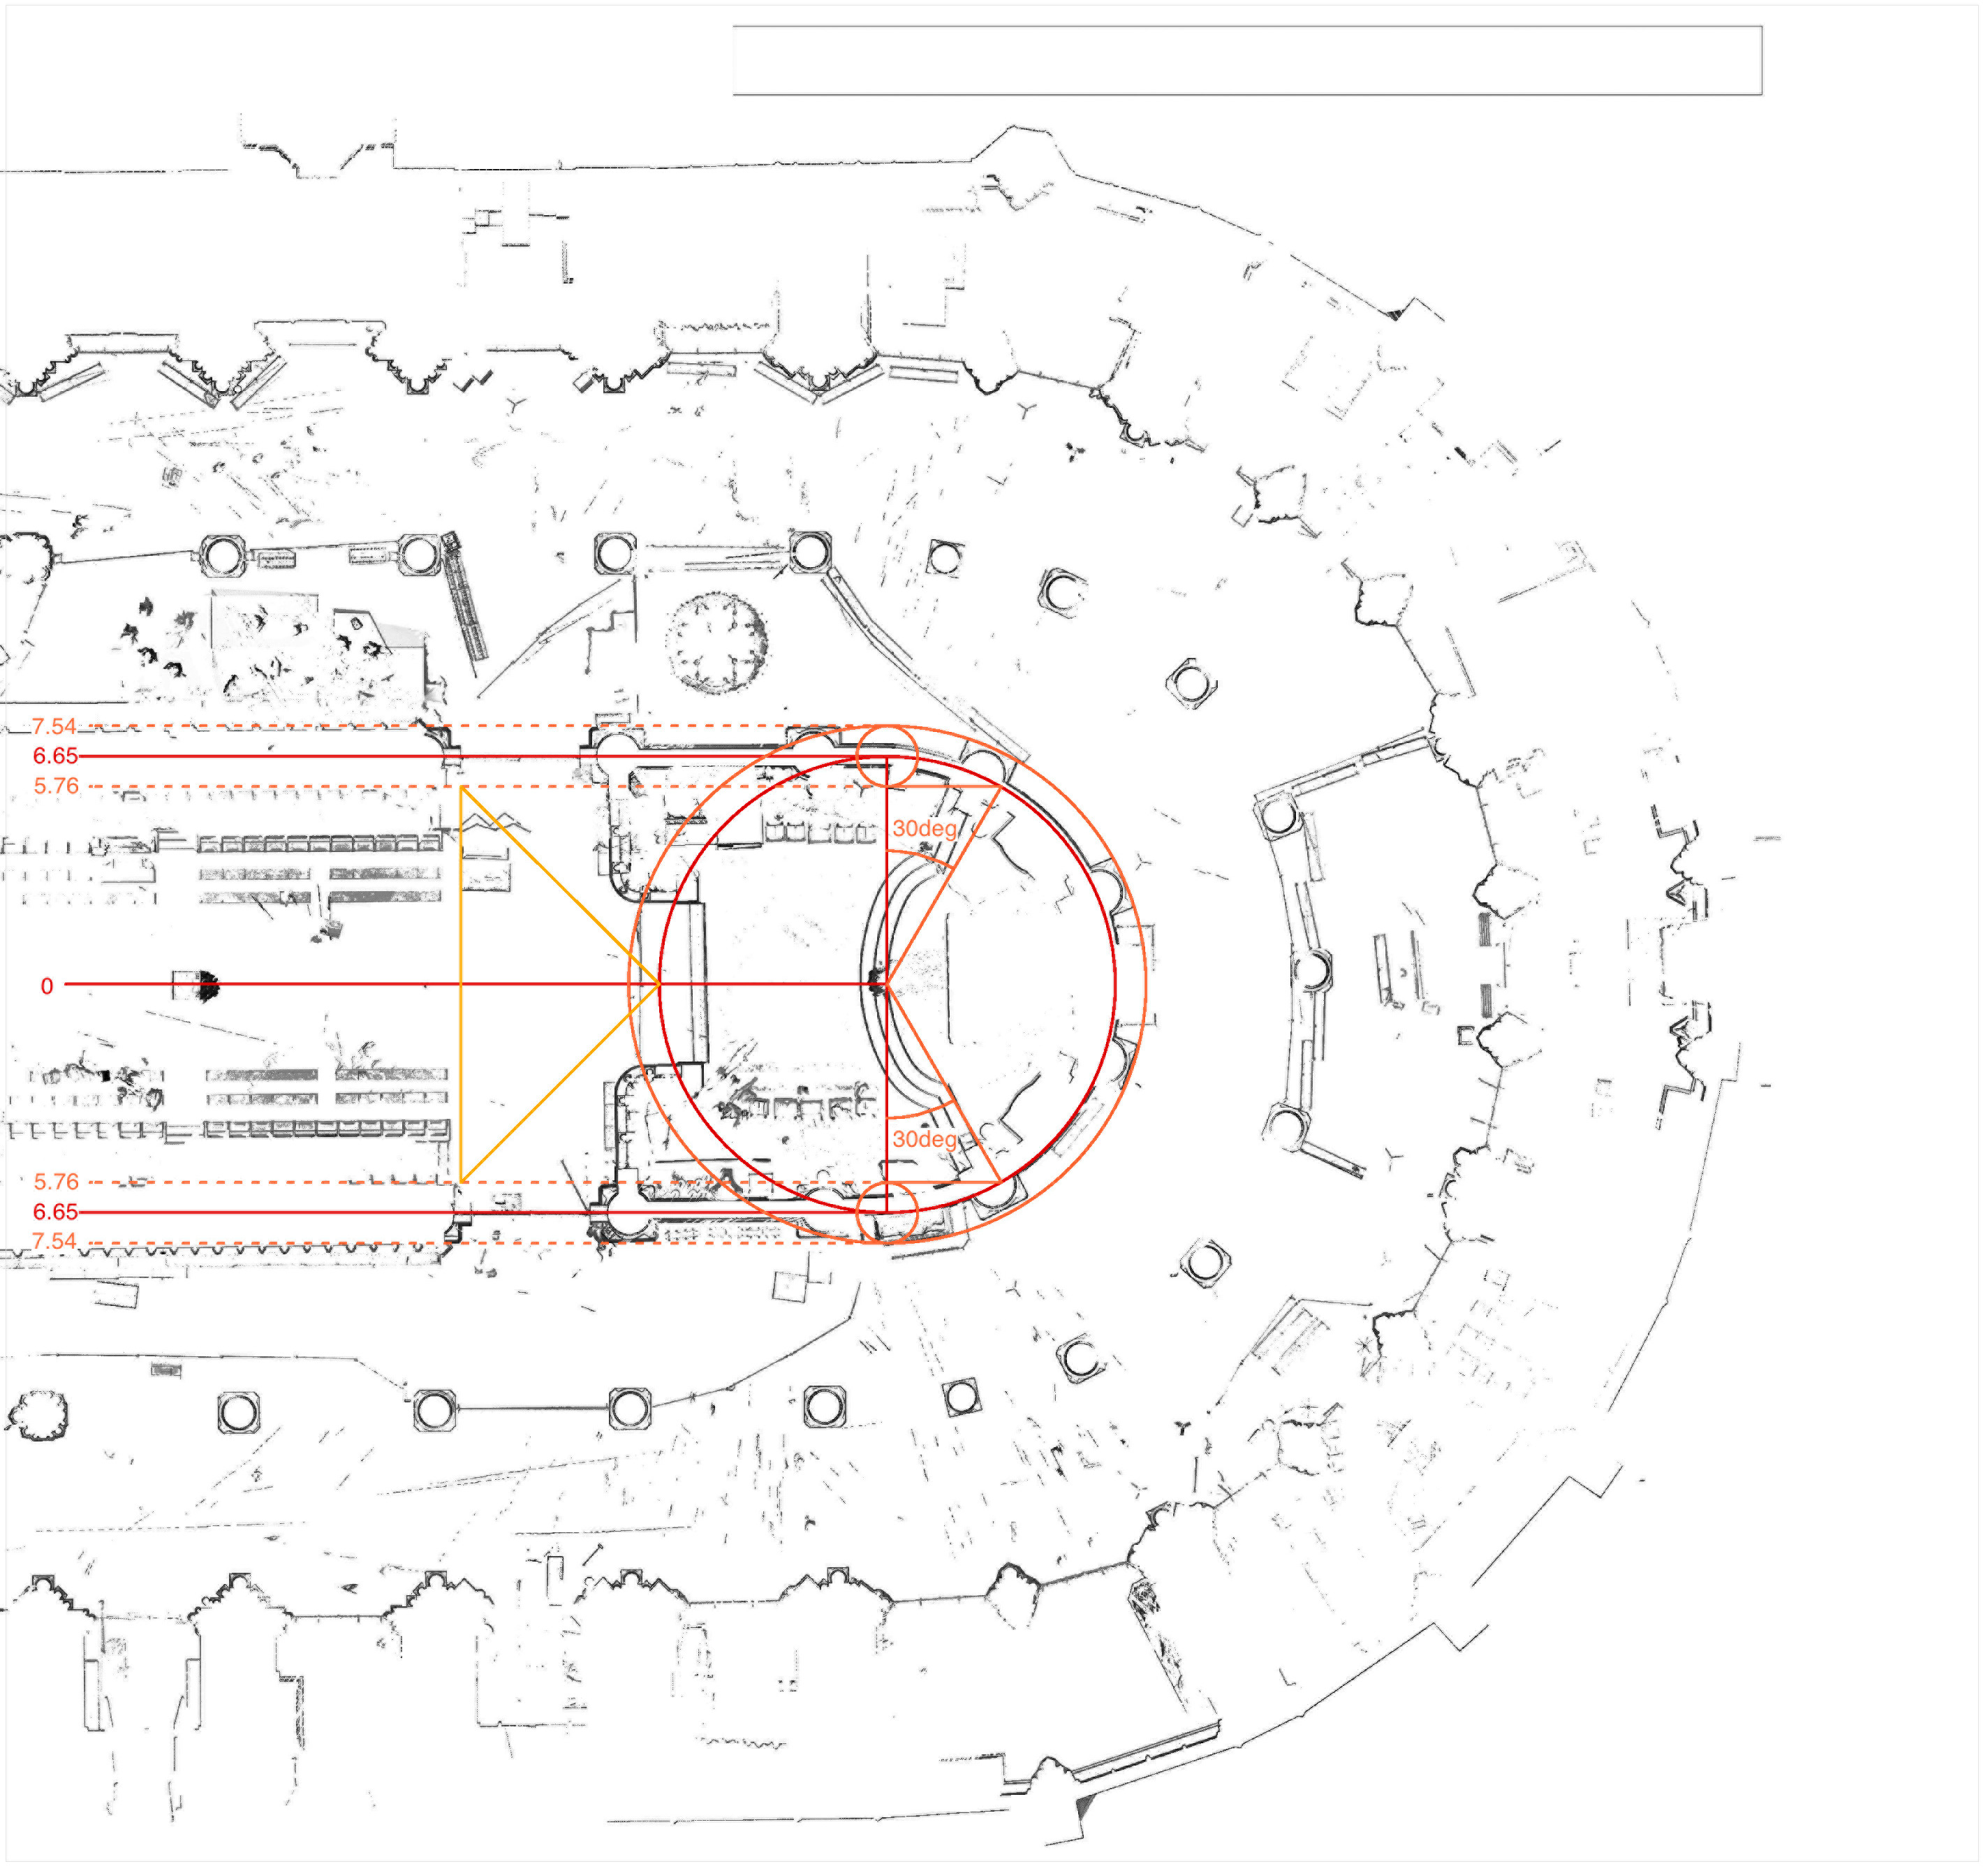
Partial plan of Notre-Dame in Paris, according to laser scan data by Andrew Tallon, showing establishment of inner arcade plinths based on construction of 30-60-90 triangles within hemicycle circle.

The next crucial step in the development of the plan is to introduce the geometry of the equilateral triangle by striking lines through the hemicycle center point with slopes 60 degrees from the cathedral’s main axis, i.e. 30 degrees from the geometrical baseline of the chevet composition. These lines intersect the hemicycle circle at points 5.76m from the building centerline, as the dotted orange lines indicate.

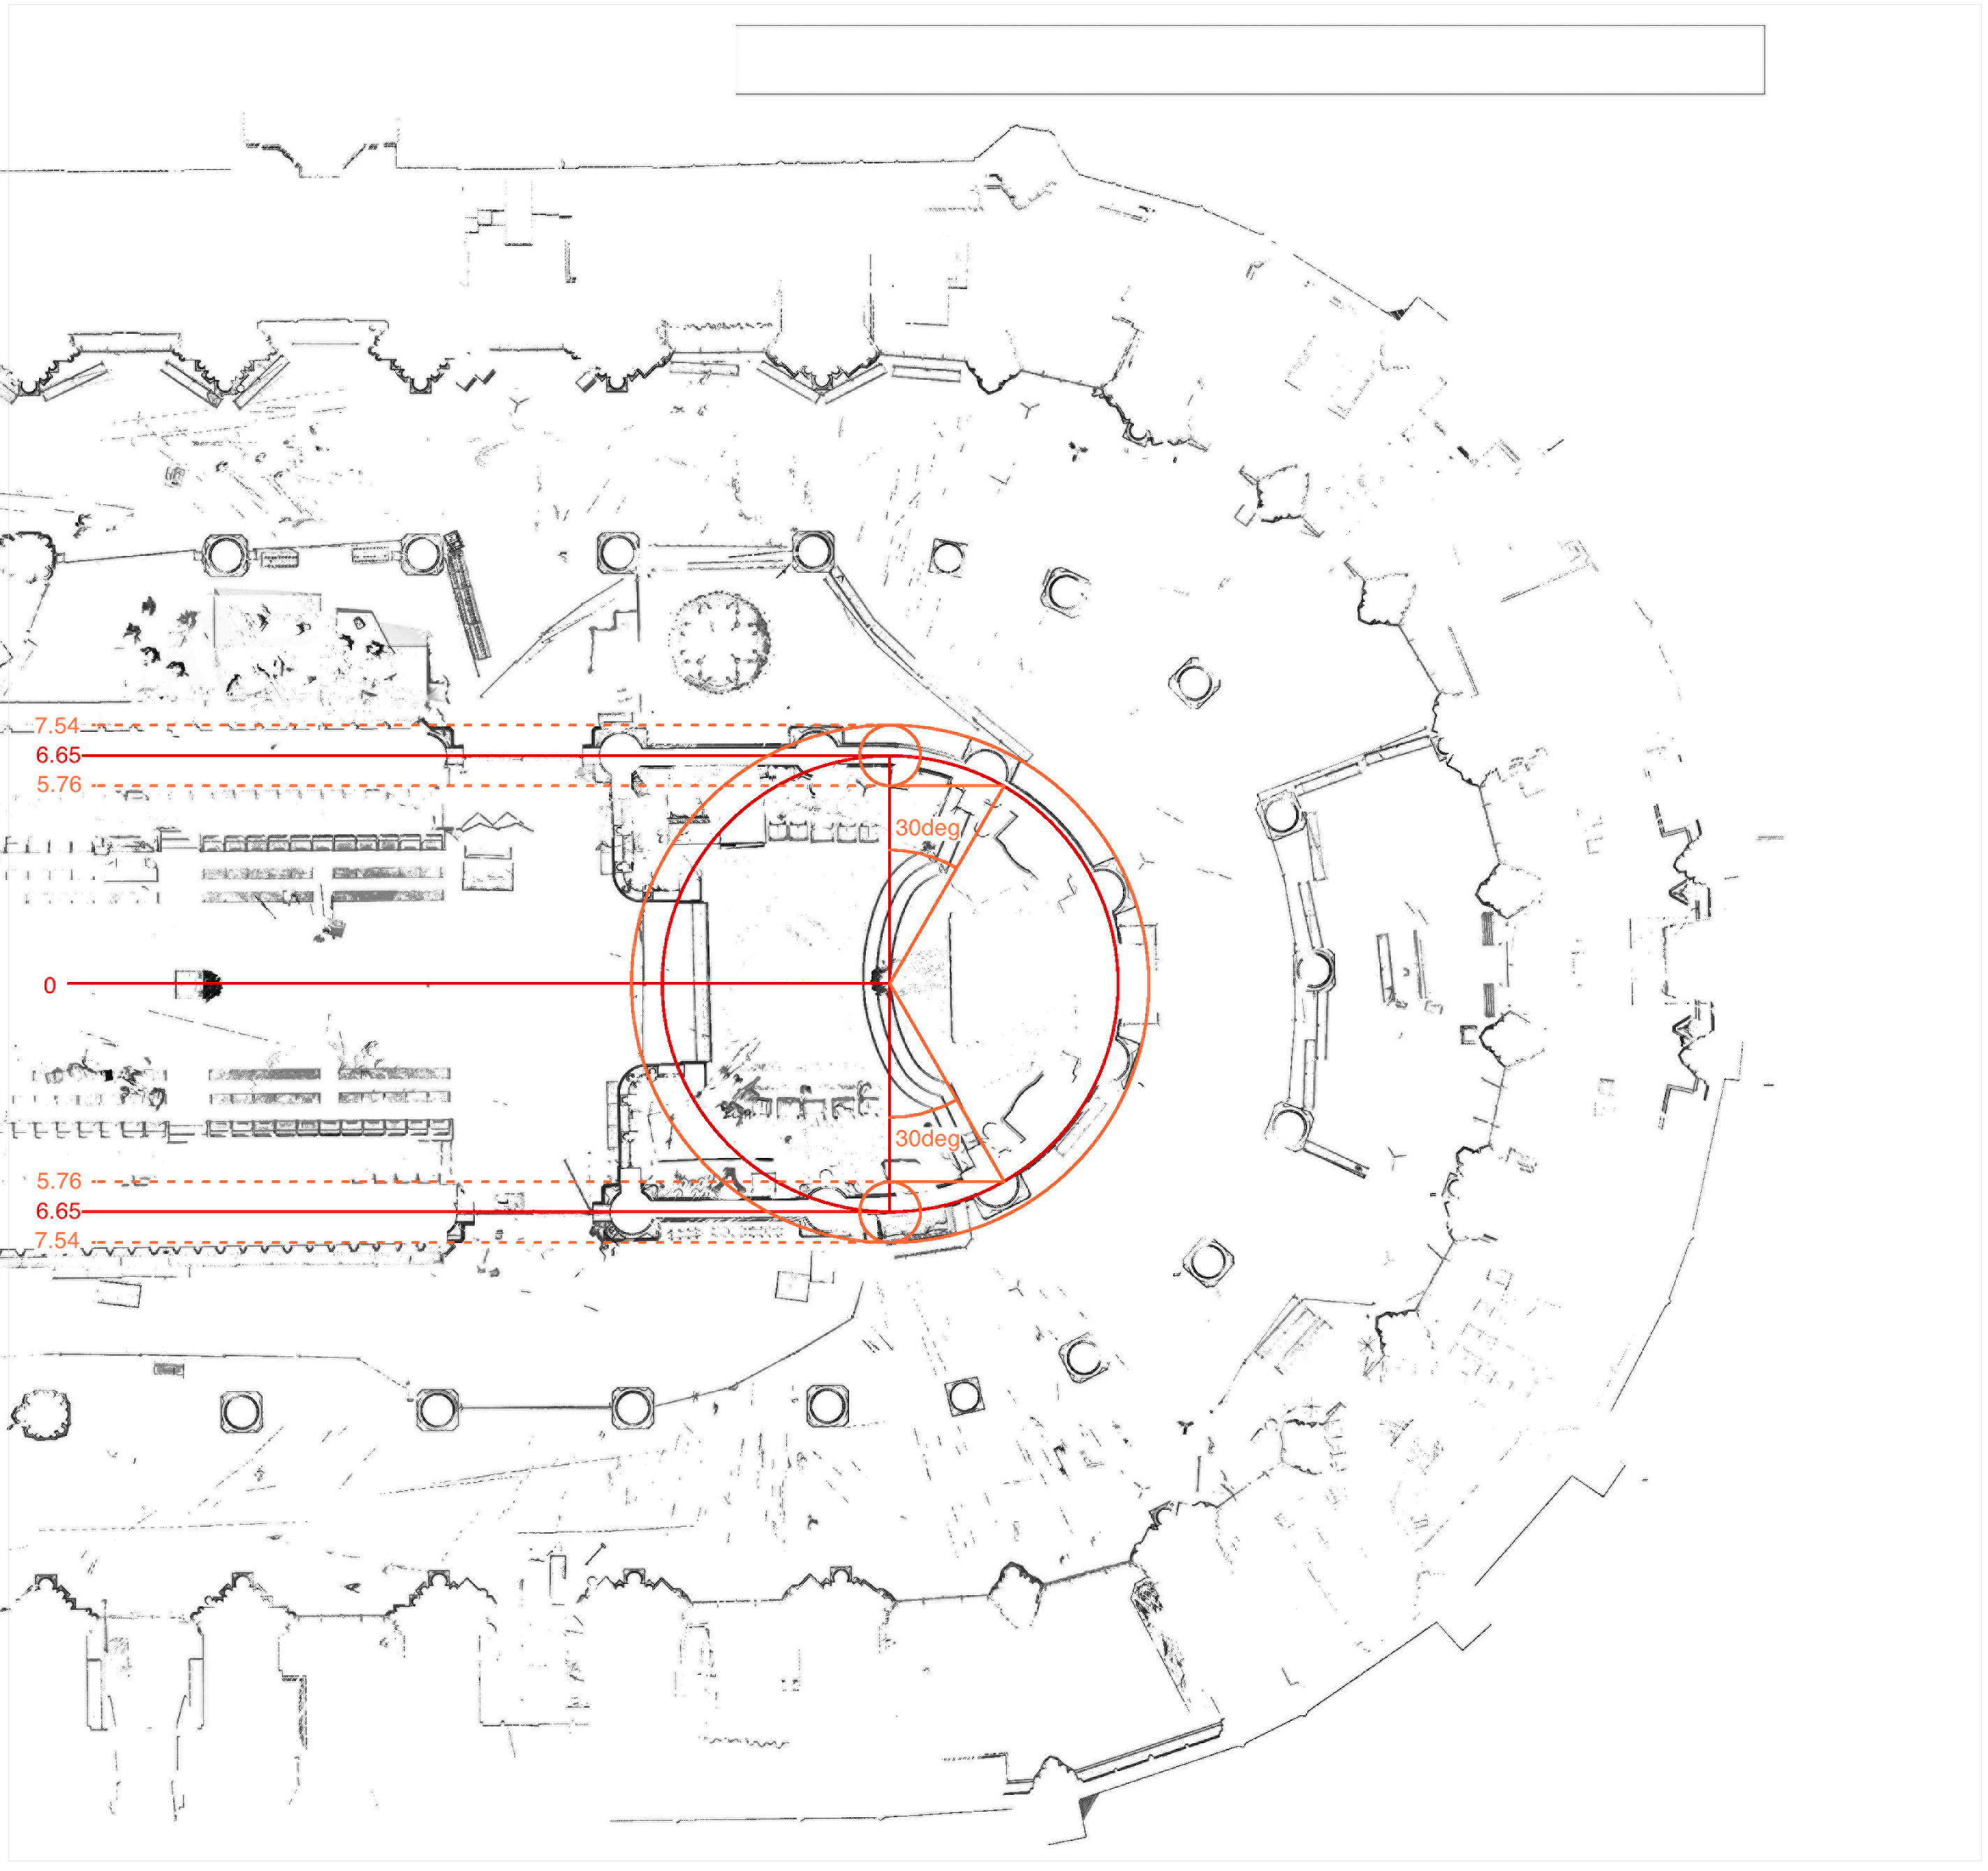
Partial plan of Notre-Dame in Paris, according to laser scan data by Andrew Tallon, showing establishment of outer arcade plinths.

These dotted orange lines can then be reflected around the main arcade axes, creating a second set of dotted orange lines 7.54m from the building centerline. These two sets of orange dotted lines frame the arcade plinths of the straight bays, and the orange circle framed by the outer lines locates the outer edges of the plinths in the hemicycle. This is already a powerful result, showing that the size of the plinths relates directly to the overall logic of the whole east end design.

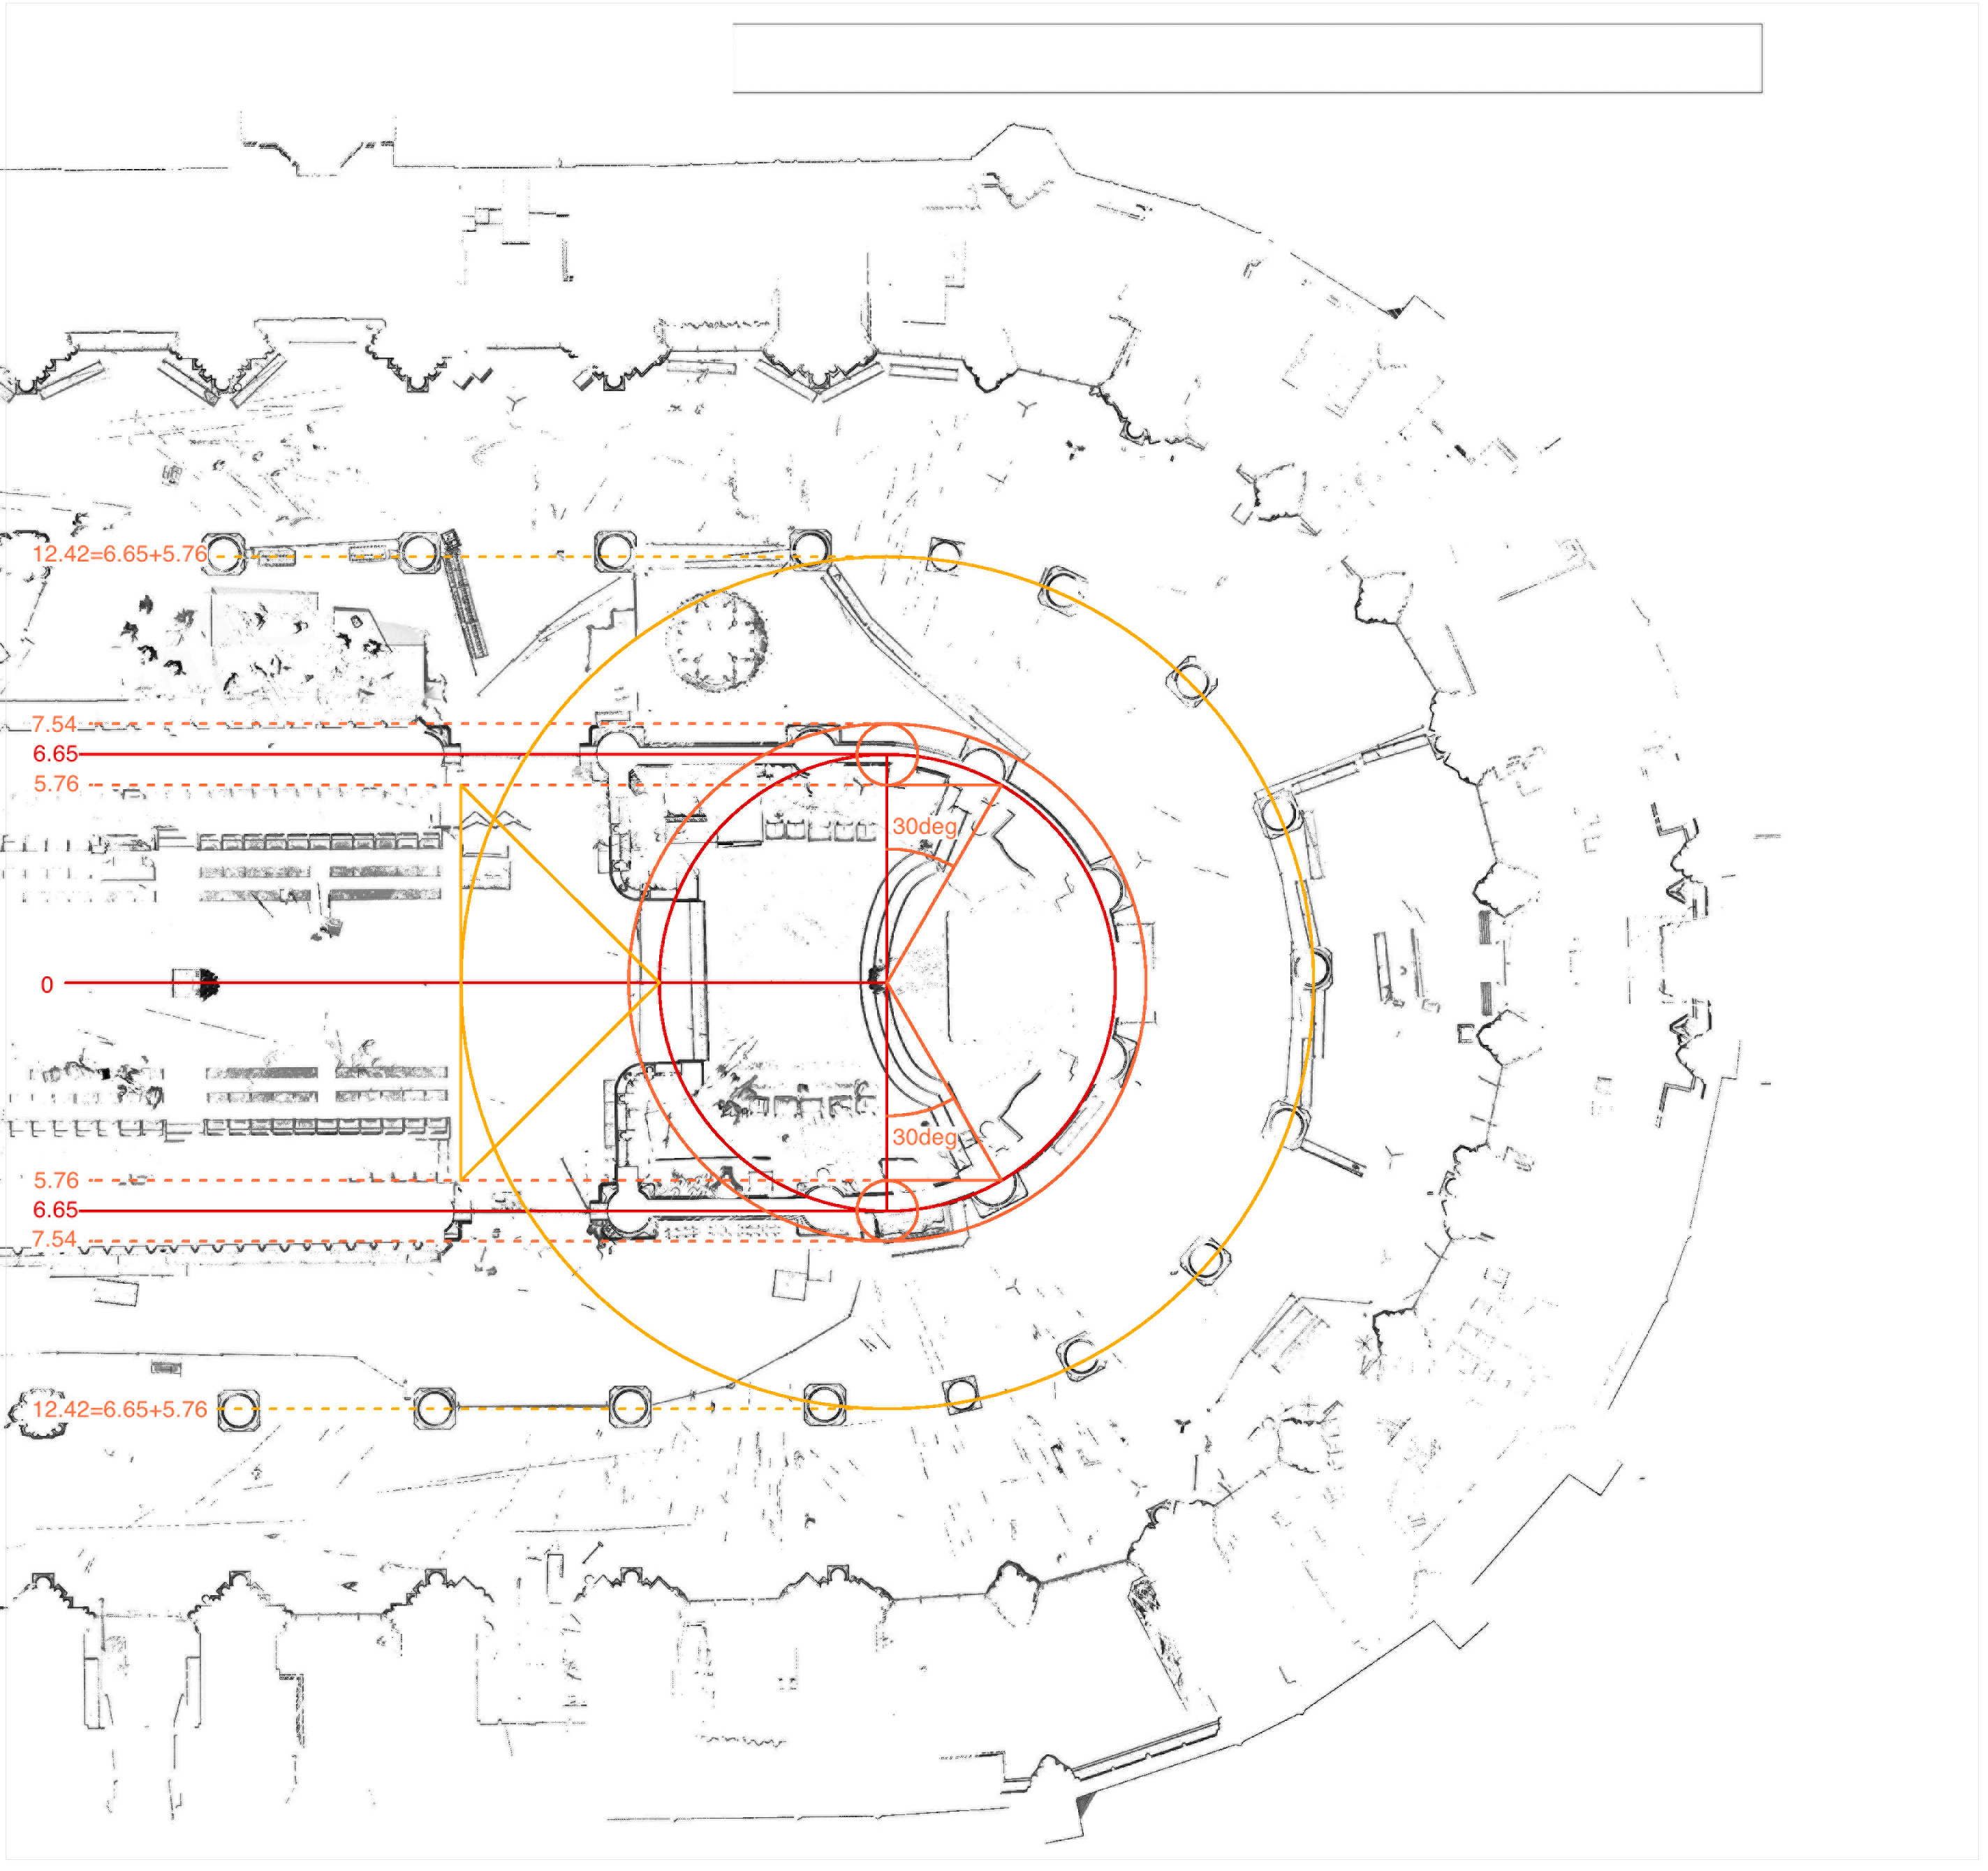
Partial plan of Notre-Dame in Paris, according to laser scan data by Andrew Tallon, showing establishment of inner aisle radius.

An important new dimension can be found by striking 45-degree diagonals westward from the westernmost point on the original red circle, and dropping a north-south line between the points where these diagonals intersect the dotted orange lines locating the inner surfaces of the arcade plinths.

Partial plan of Notre-Dame in Paris, according to laser scan data by Andrew Tallon, showing construction of inner aisle.

A yellow circle concentric with the hemicycle and tangent to this north-south line thus has a radius of 6.65m + 5.76m = 12.42m. This circle passes precisely through the centers of the piers separating the inner and outer ambulatories in the chevet, and tangents to this circle play the analogous role in the straight bays.

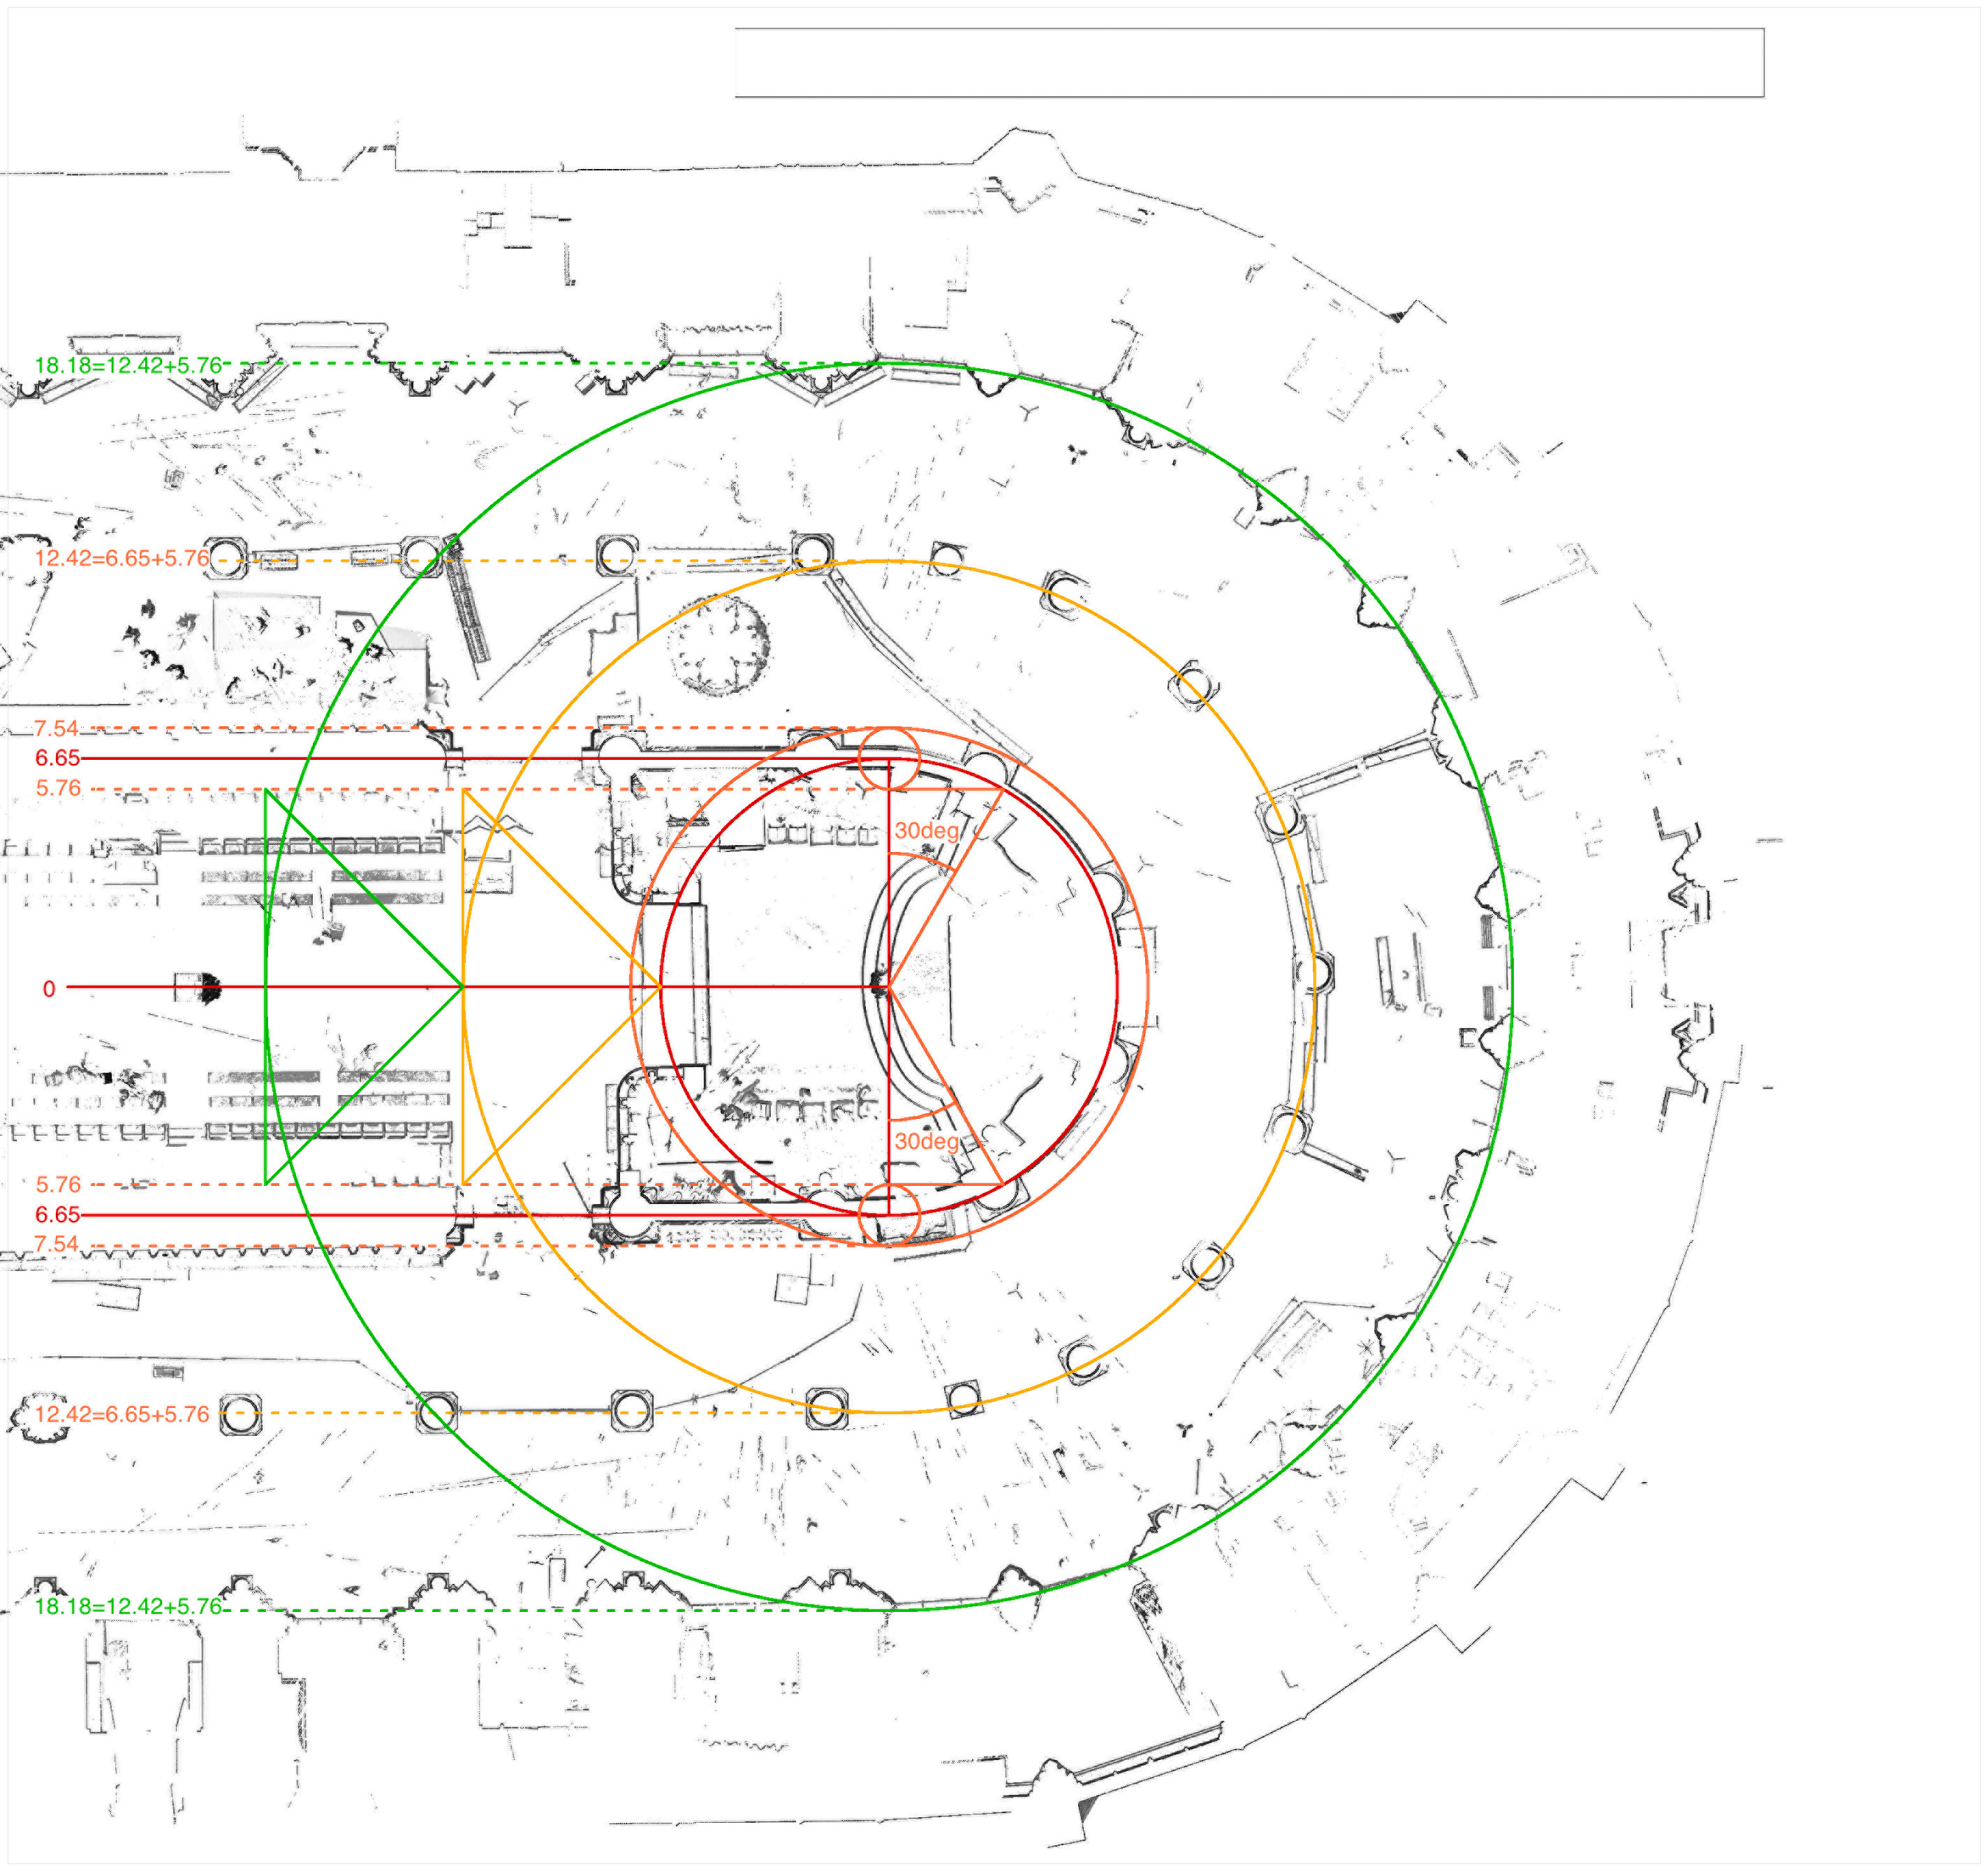
Partial plan of Notre-Dame in Paris, according to laser scan data by Andrew Tallon, showing construction of outer aisle.

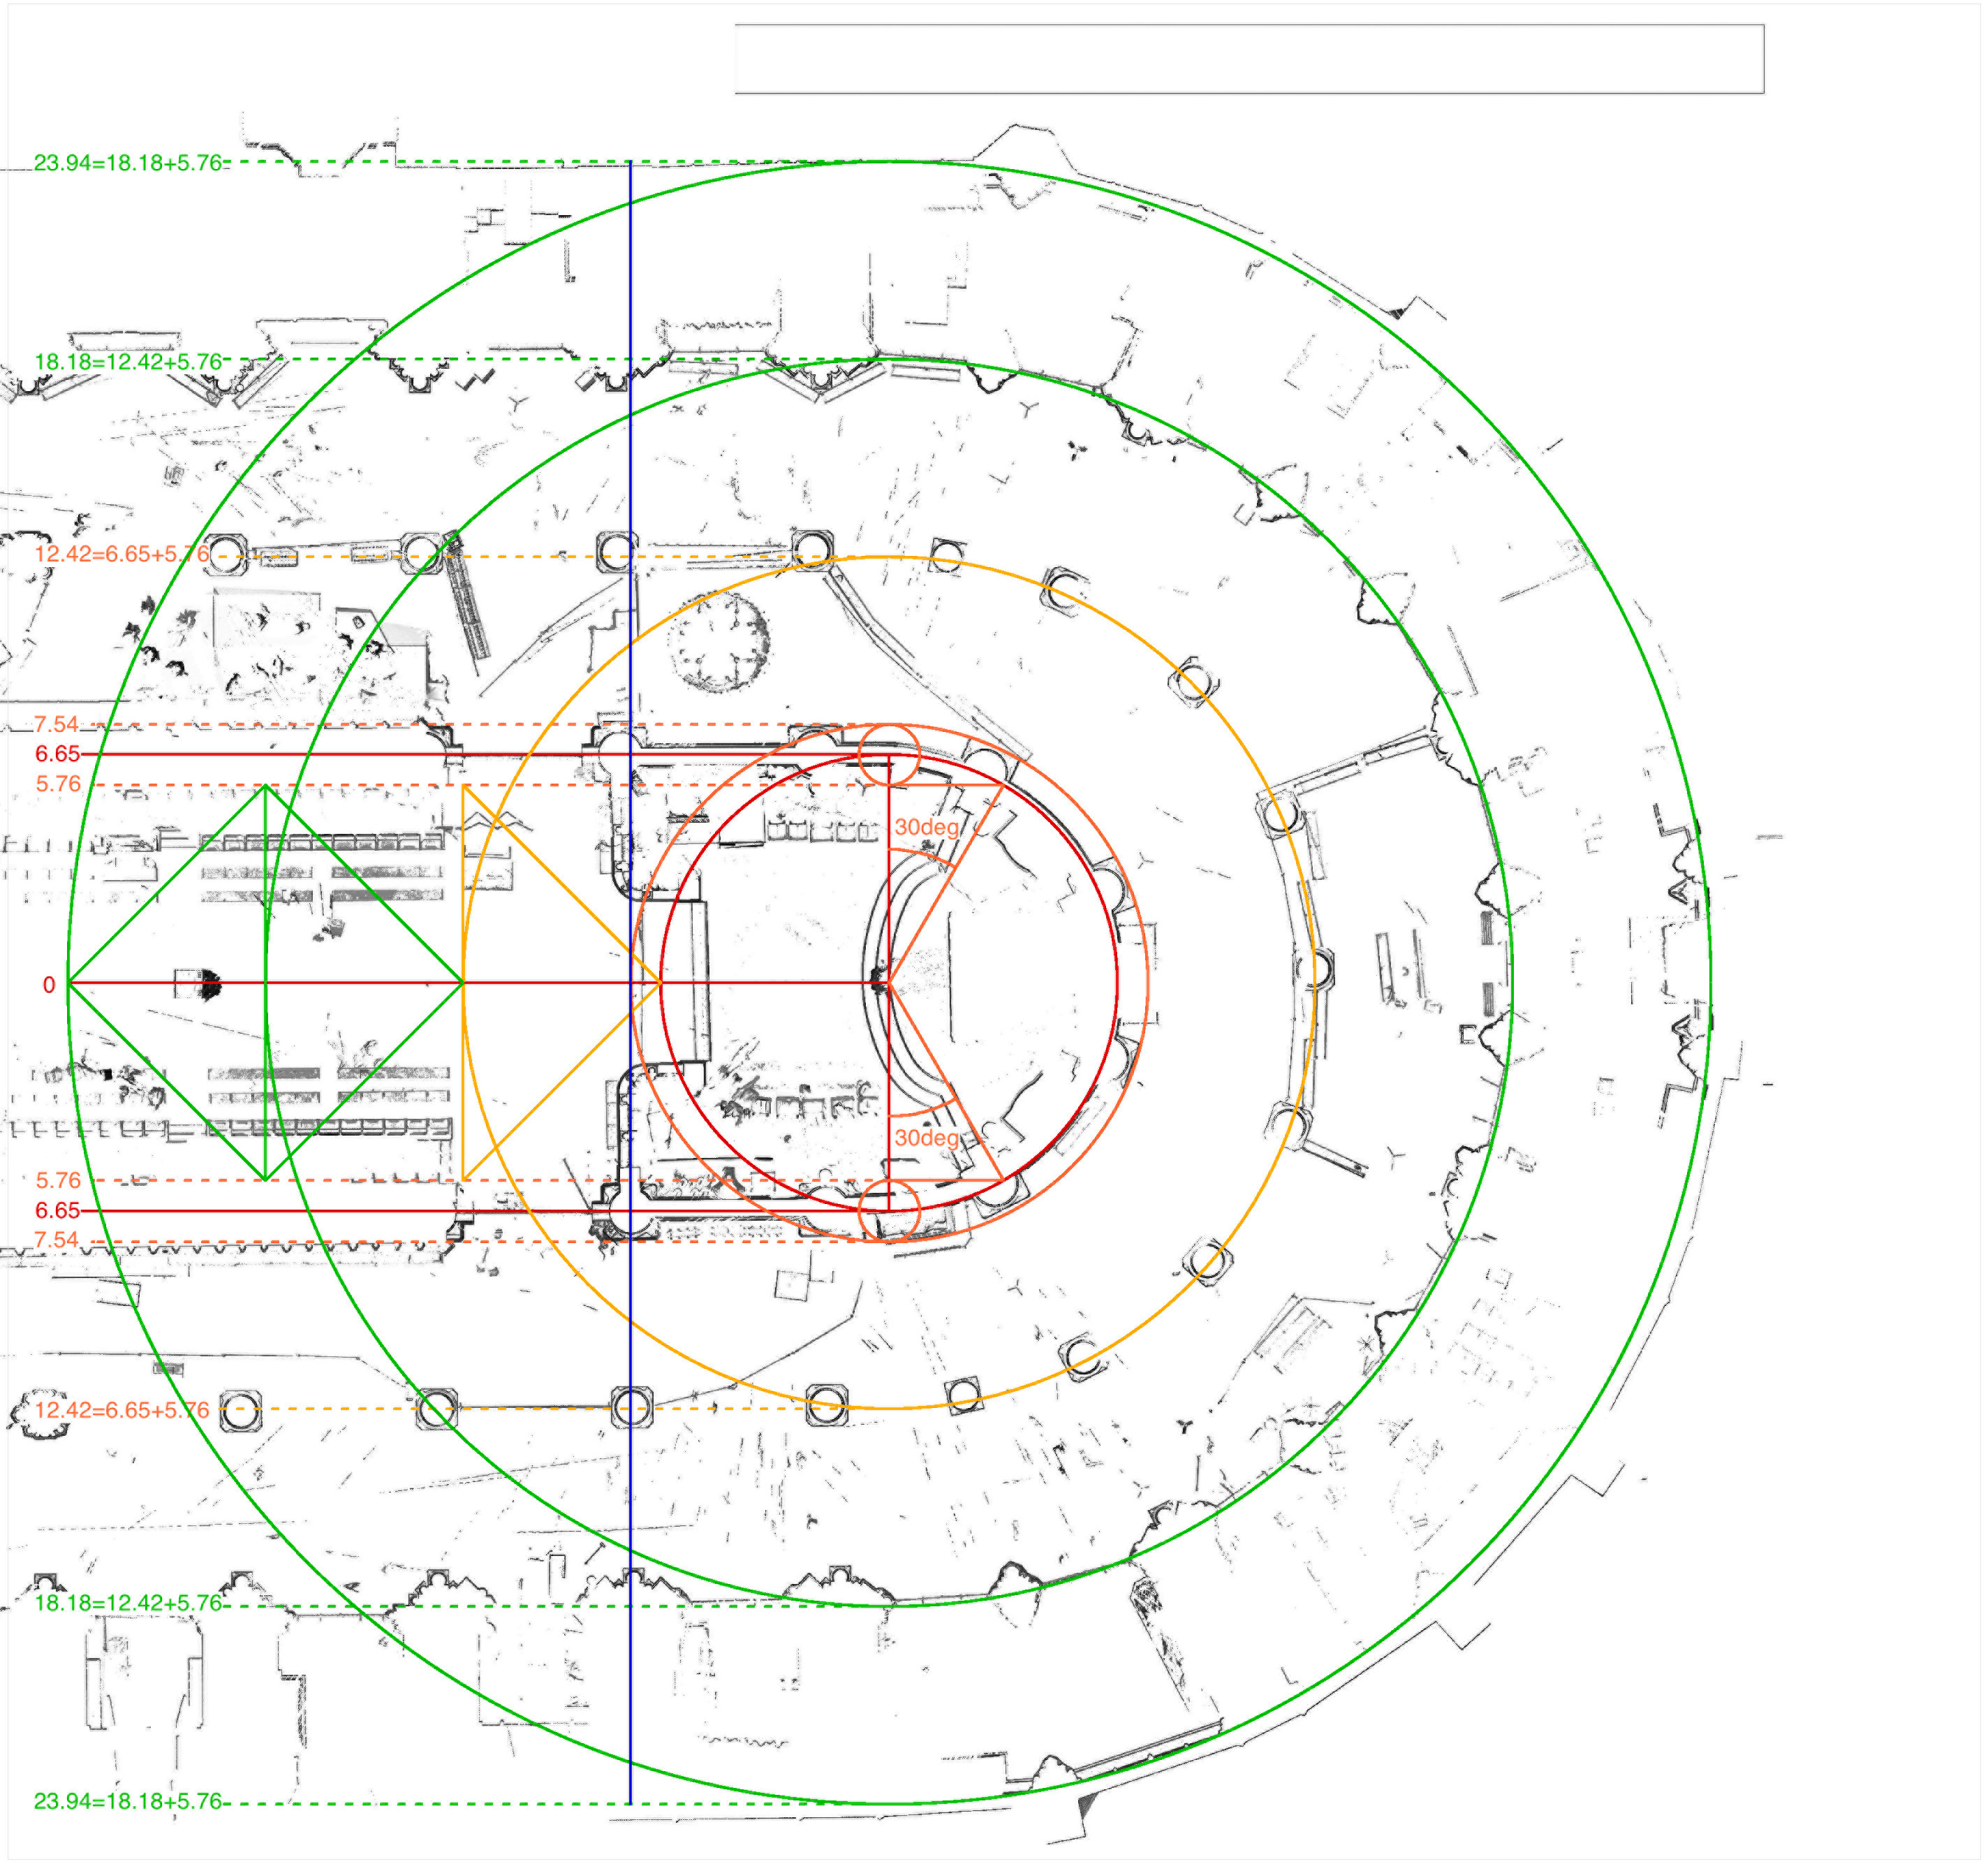
Repeating the same basic operation, one can find the green circle that locates the original outer wall surface of the cathedral; its radius is 12.42m + 5.76m = 18.18m.

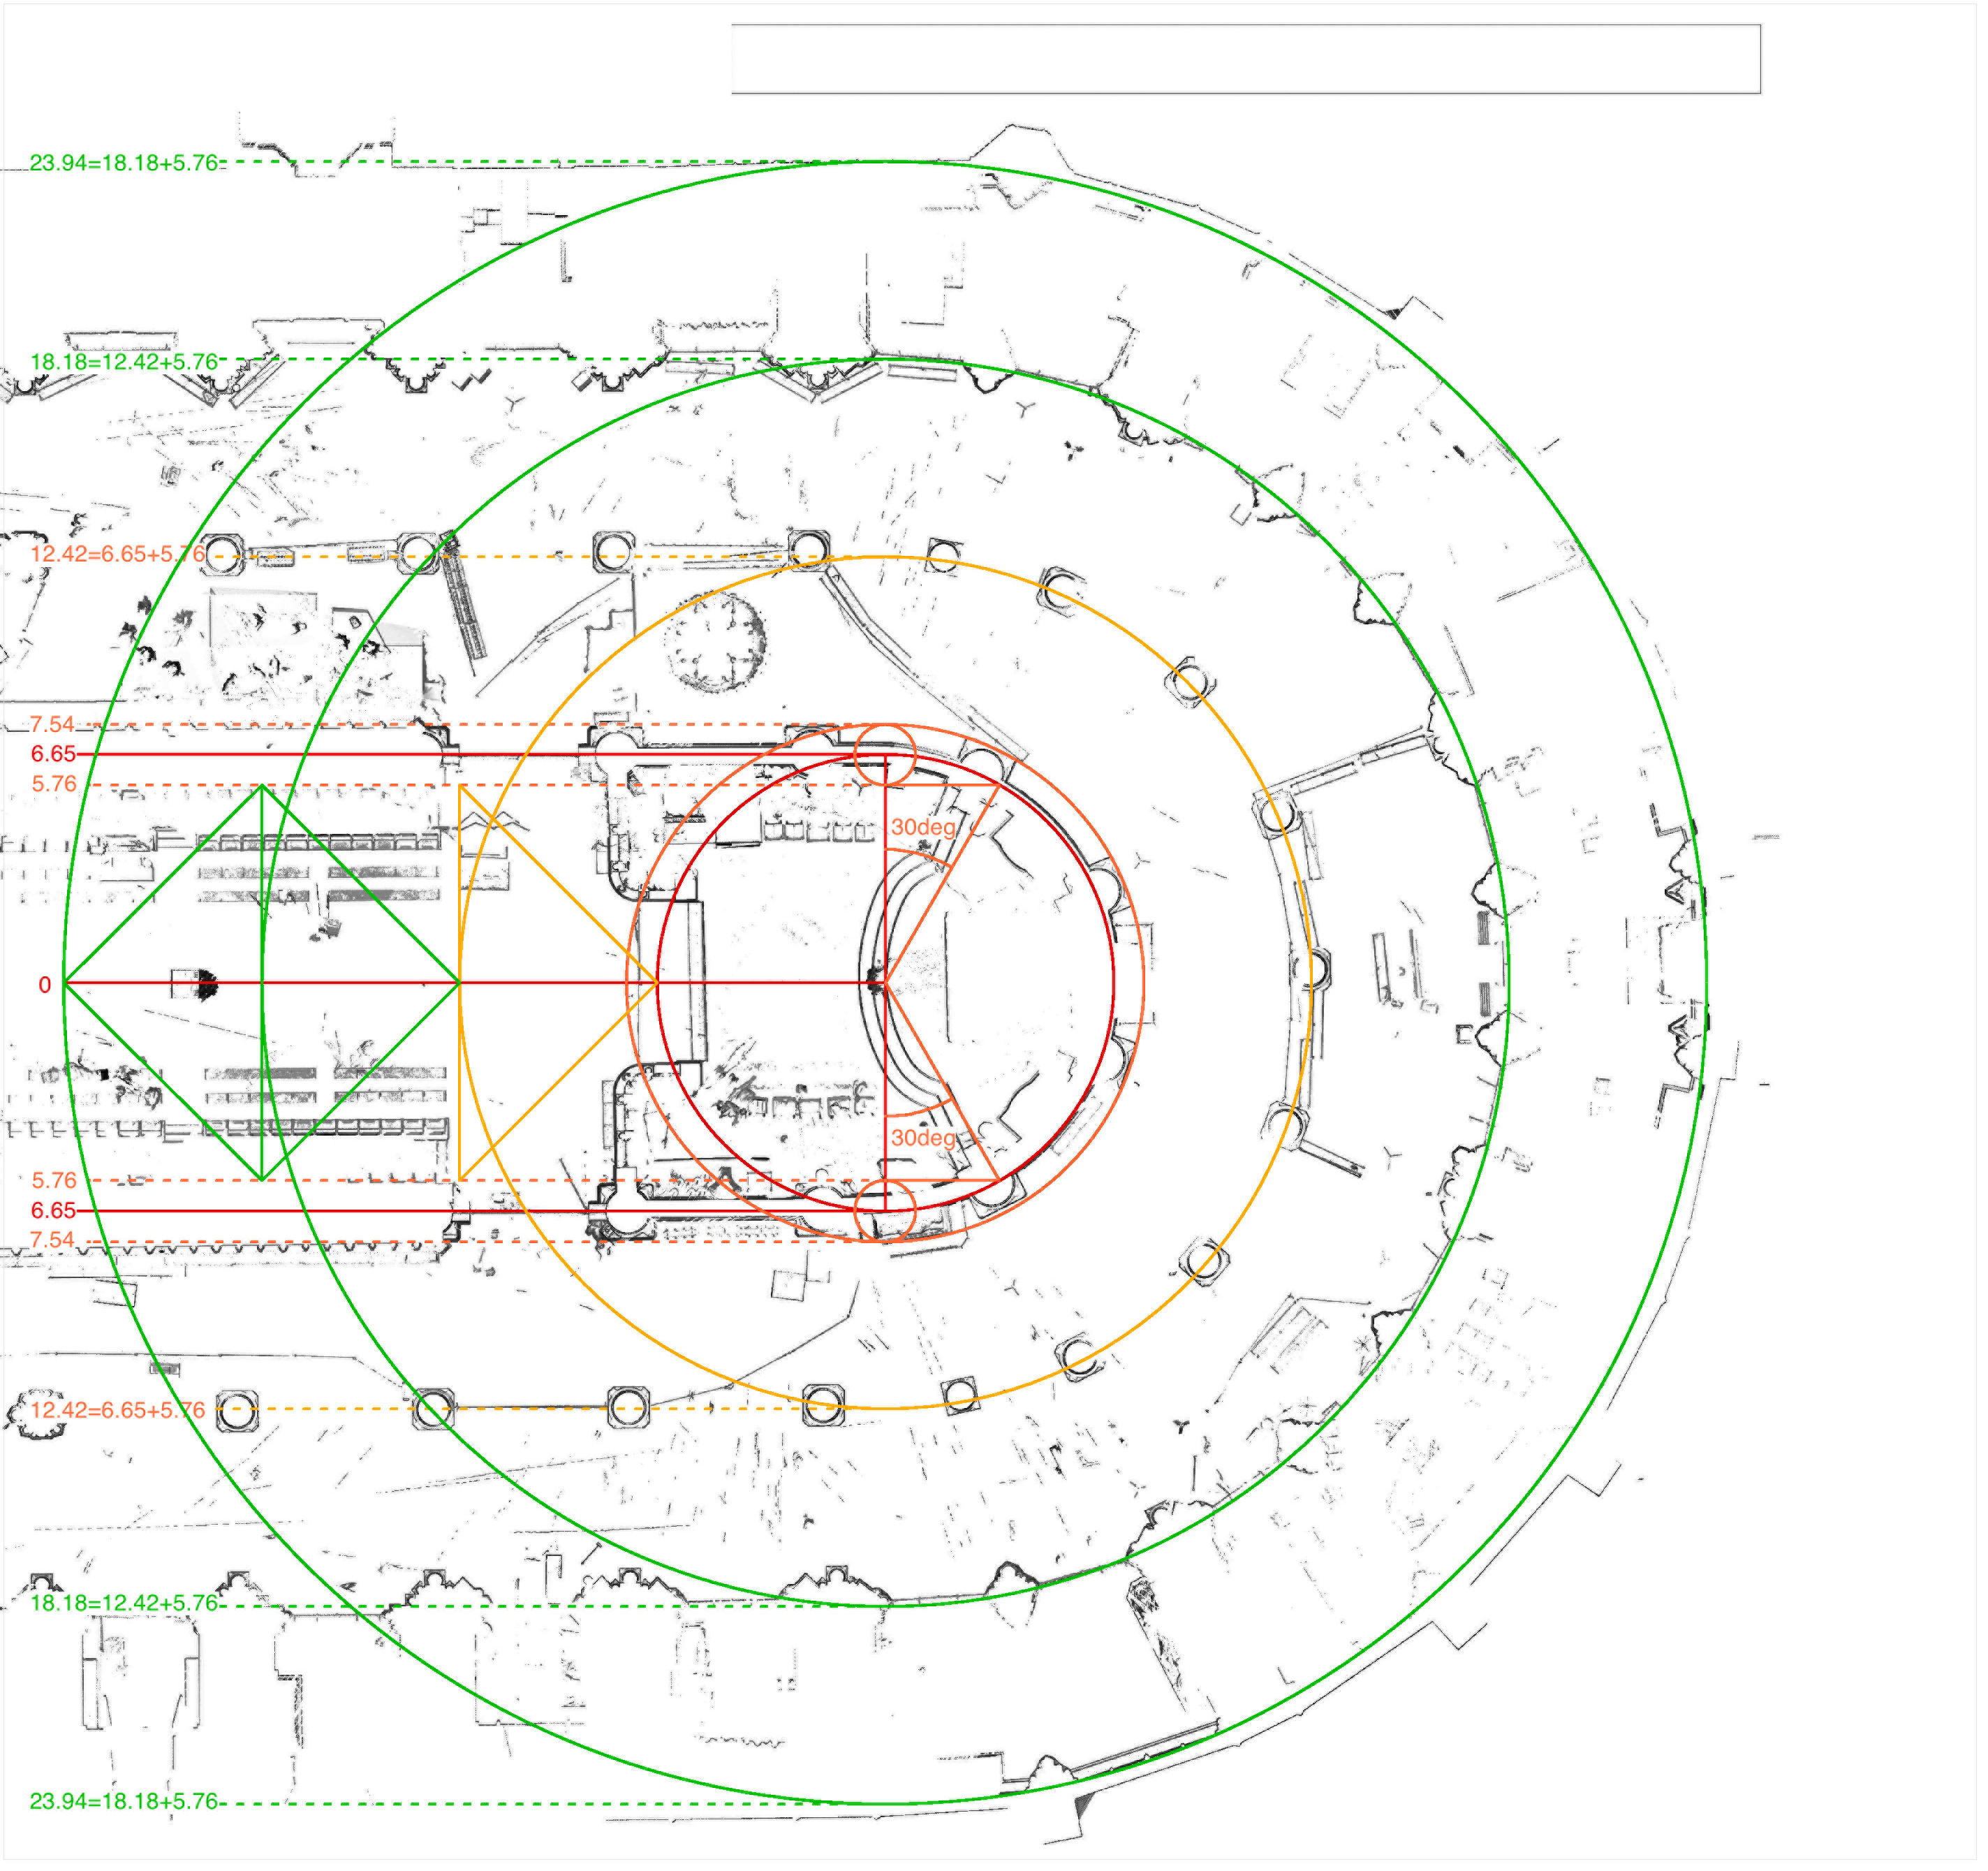
Partial plan of Notre-Dame in Paris, according to laser scan data by Andrew Tallon, showing construction of buttress depths.

Repeating this operation yet again, one finds the green circle that locates the wall surface of the cathedral in its present state, with chapels added between the buttresses. The radius of this largest circle is thus 18.18m + 5.76m = 23.94m. The geometrical steps taken so far thus explain the 5.76m width of the three belts wrapping around the choir; in modern mathematical parlance, one can observe that their 5.76m width is smaller than the 6.65m half-span of the choir by a factor of cosine (30 degrees) = .866. The twelfth-century designer of the Notre-Dame ground plan, however, could create this relationship quite easily, using his compass to create the 30-degree geometry first introduced by the orange lines seen in this series of graphics. Having established these radii and the widths of the aisles, the next step in the design process would have been to subdivide the composition into bays.

Partial plan of Notre-Dame in Paris, according to laser scan data by Andrew Tallon, showing establishment of north-south pier axes on south side of the cathedral.

There is good reason to think that the first piers built at Notre-Dame may have been those separating the first and second straight bays on the south side of the choir. Their centers align quite precisely with the blue tangent to the orange circle circumscribing the hemicycle plinths, as the bottom portion of this graphic indicates. The corresponding columns on the north side of the church, though, are displaced roughly a column radius to the west, as the top part of the graphic shows. This anomaly results from an overall rotation of the chevet geometry to the north. Before going on to explore that layout error, though, it is necessary to consider the logic guiding the radial subdivision of the chevet.

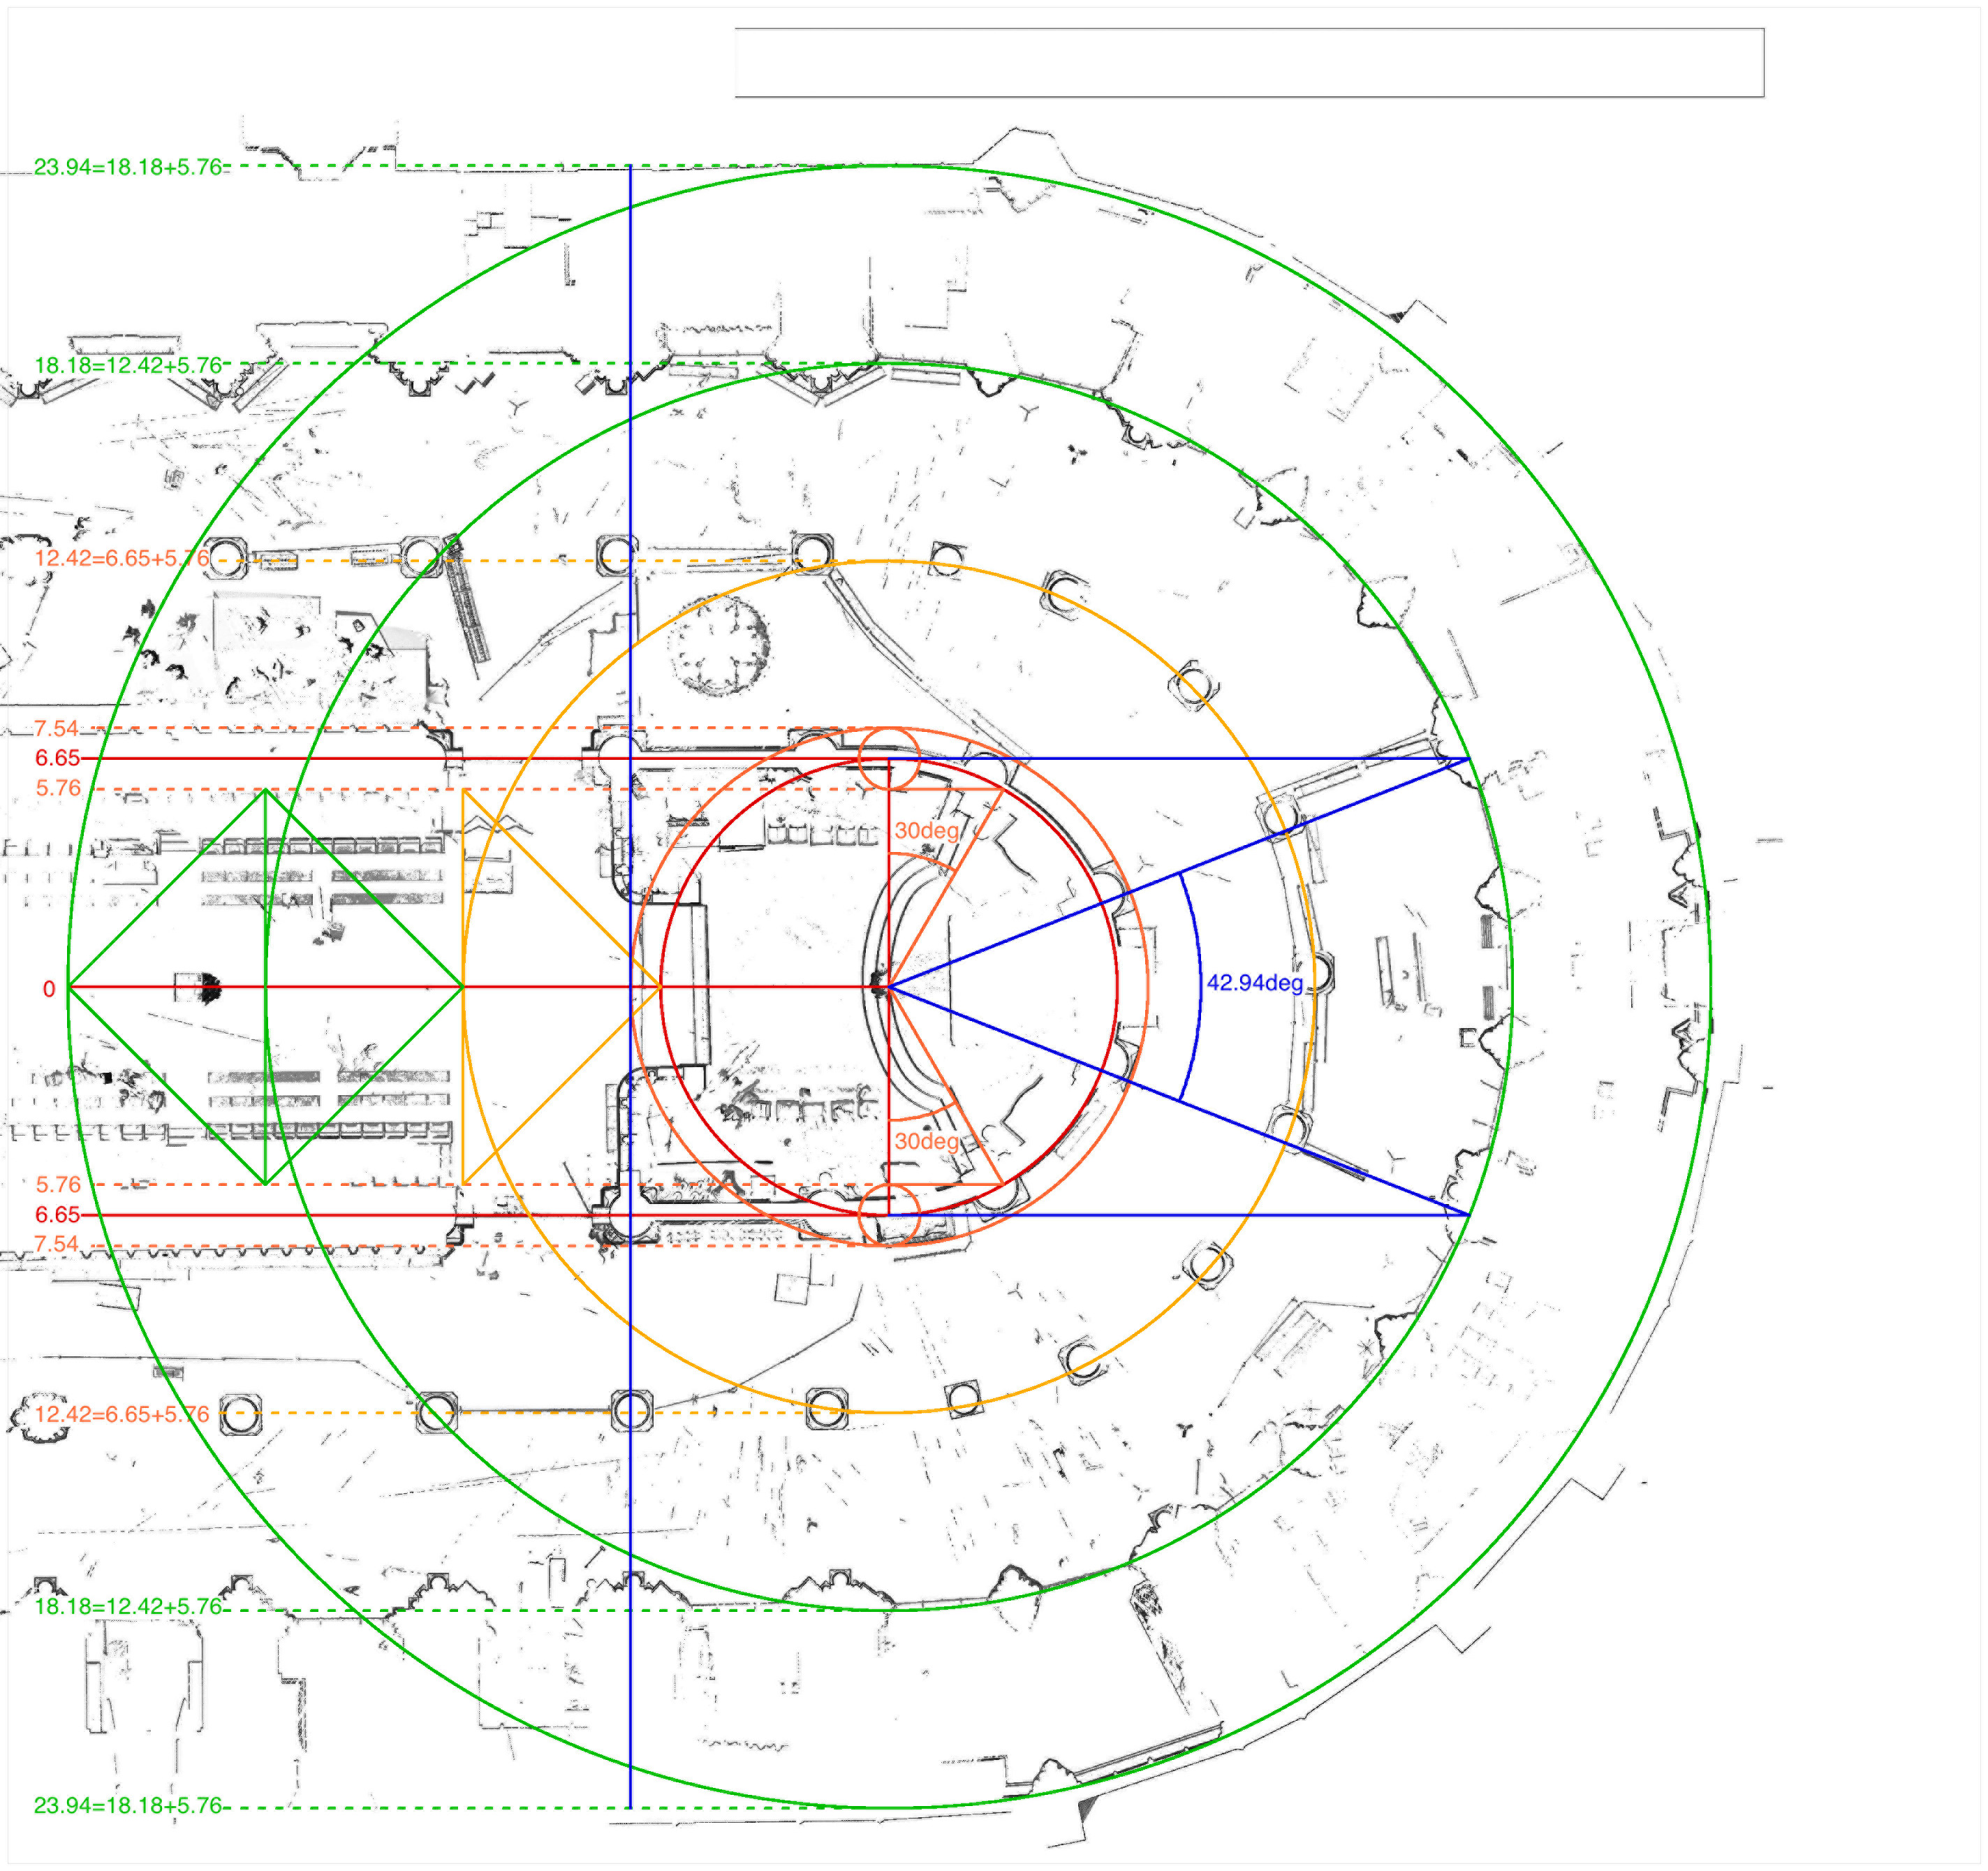
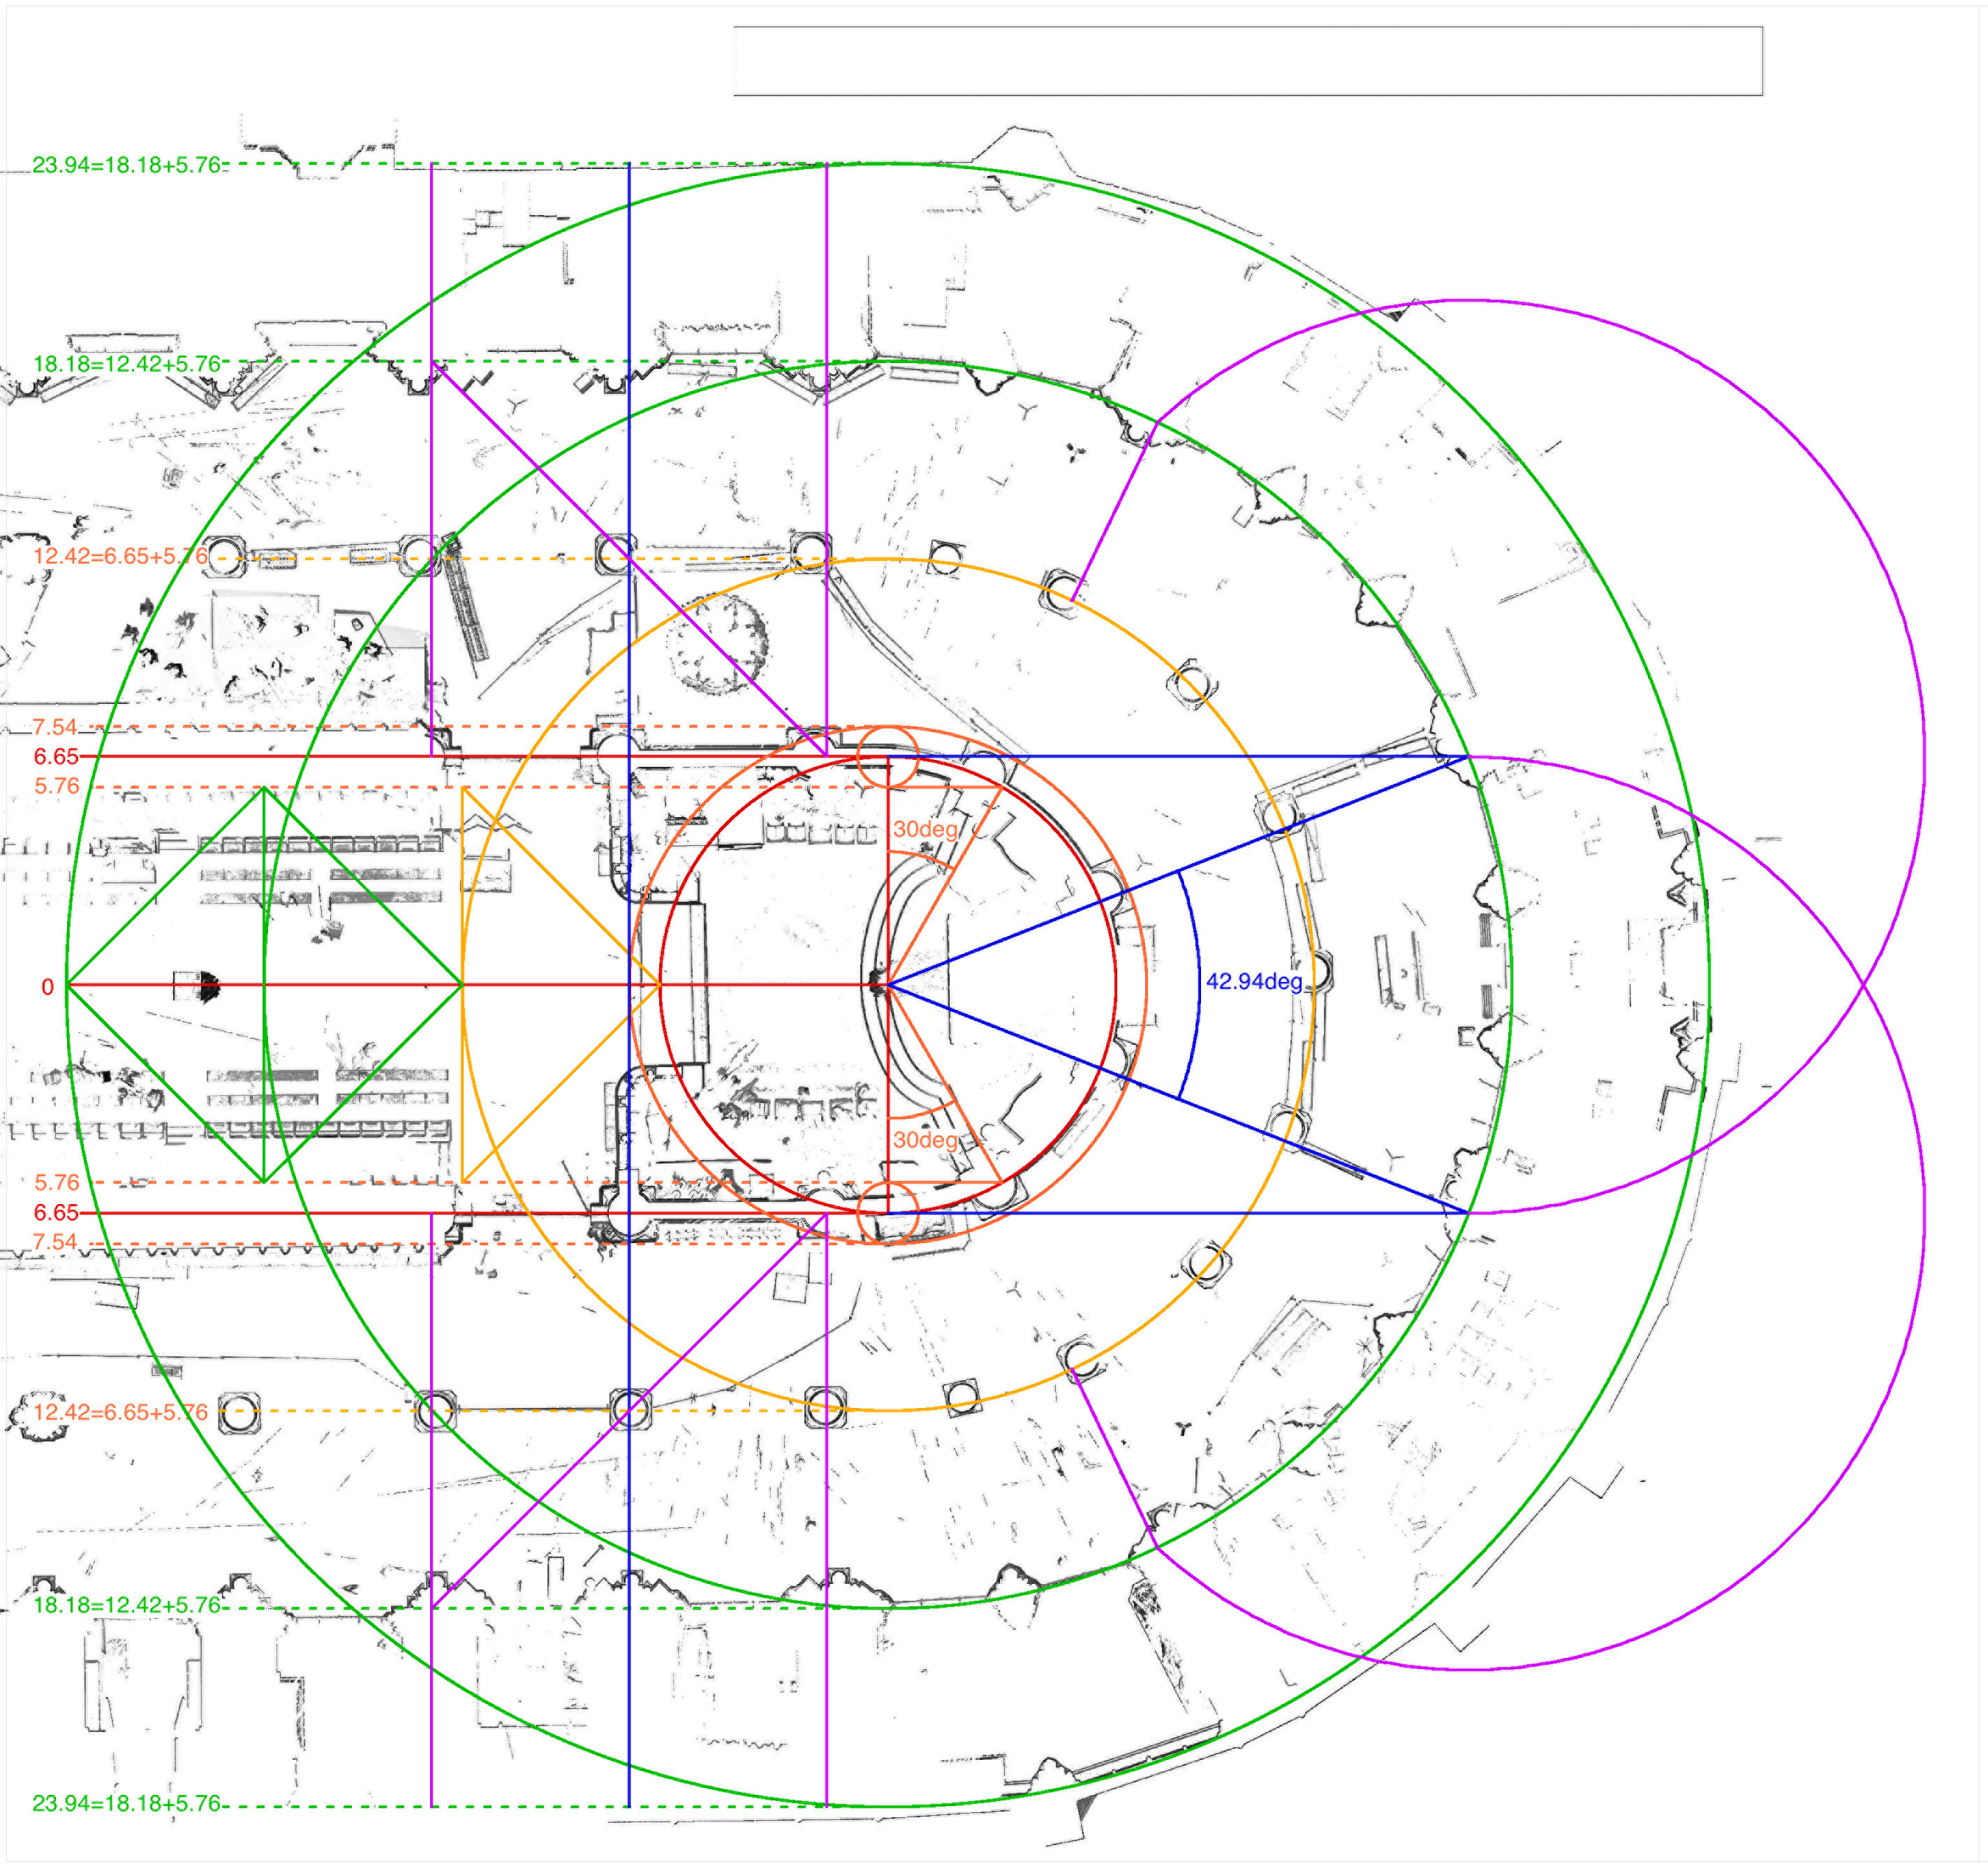
Partial plan of Notre-Dame in Paris, according to laser scan data by Andrew Tallon, showing intended construction of central chevet wedge.

When the lines describing the arcade axes are continued to the east, they intersect the inner green circle at points 42.94 degrees apart, as the blue lines show. This closely matches the angular width of the central wedge in the chevet; the slight rotation of the chevet to the north does not change its angular width.

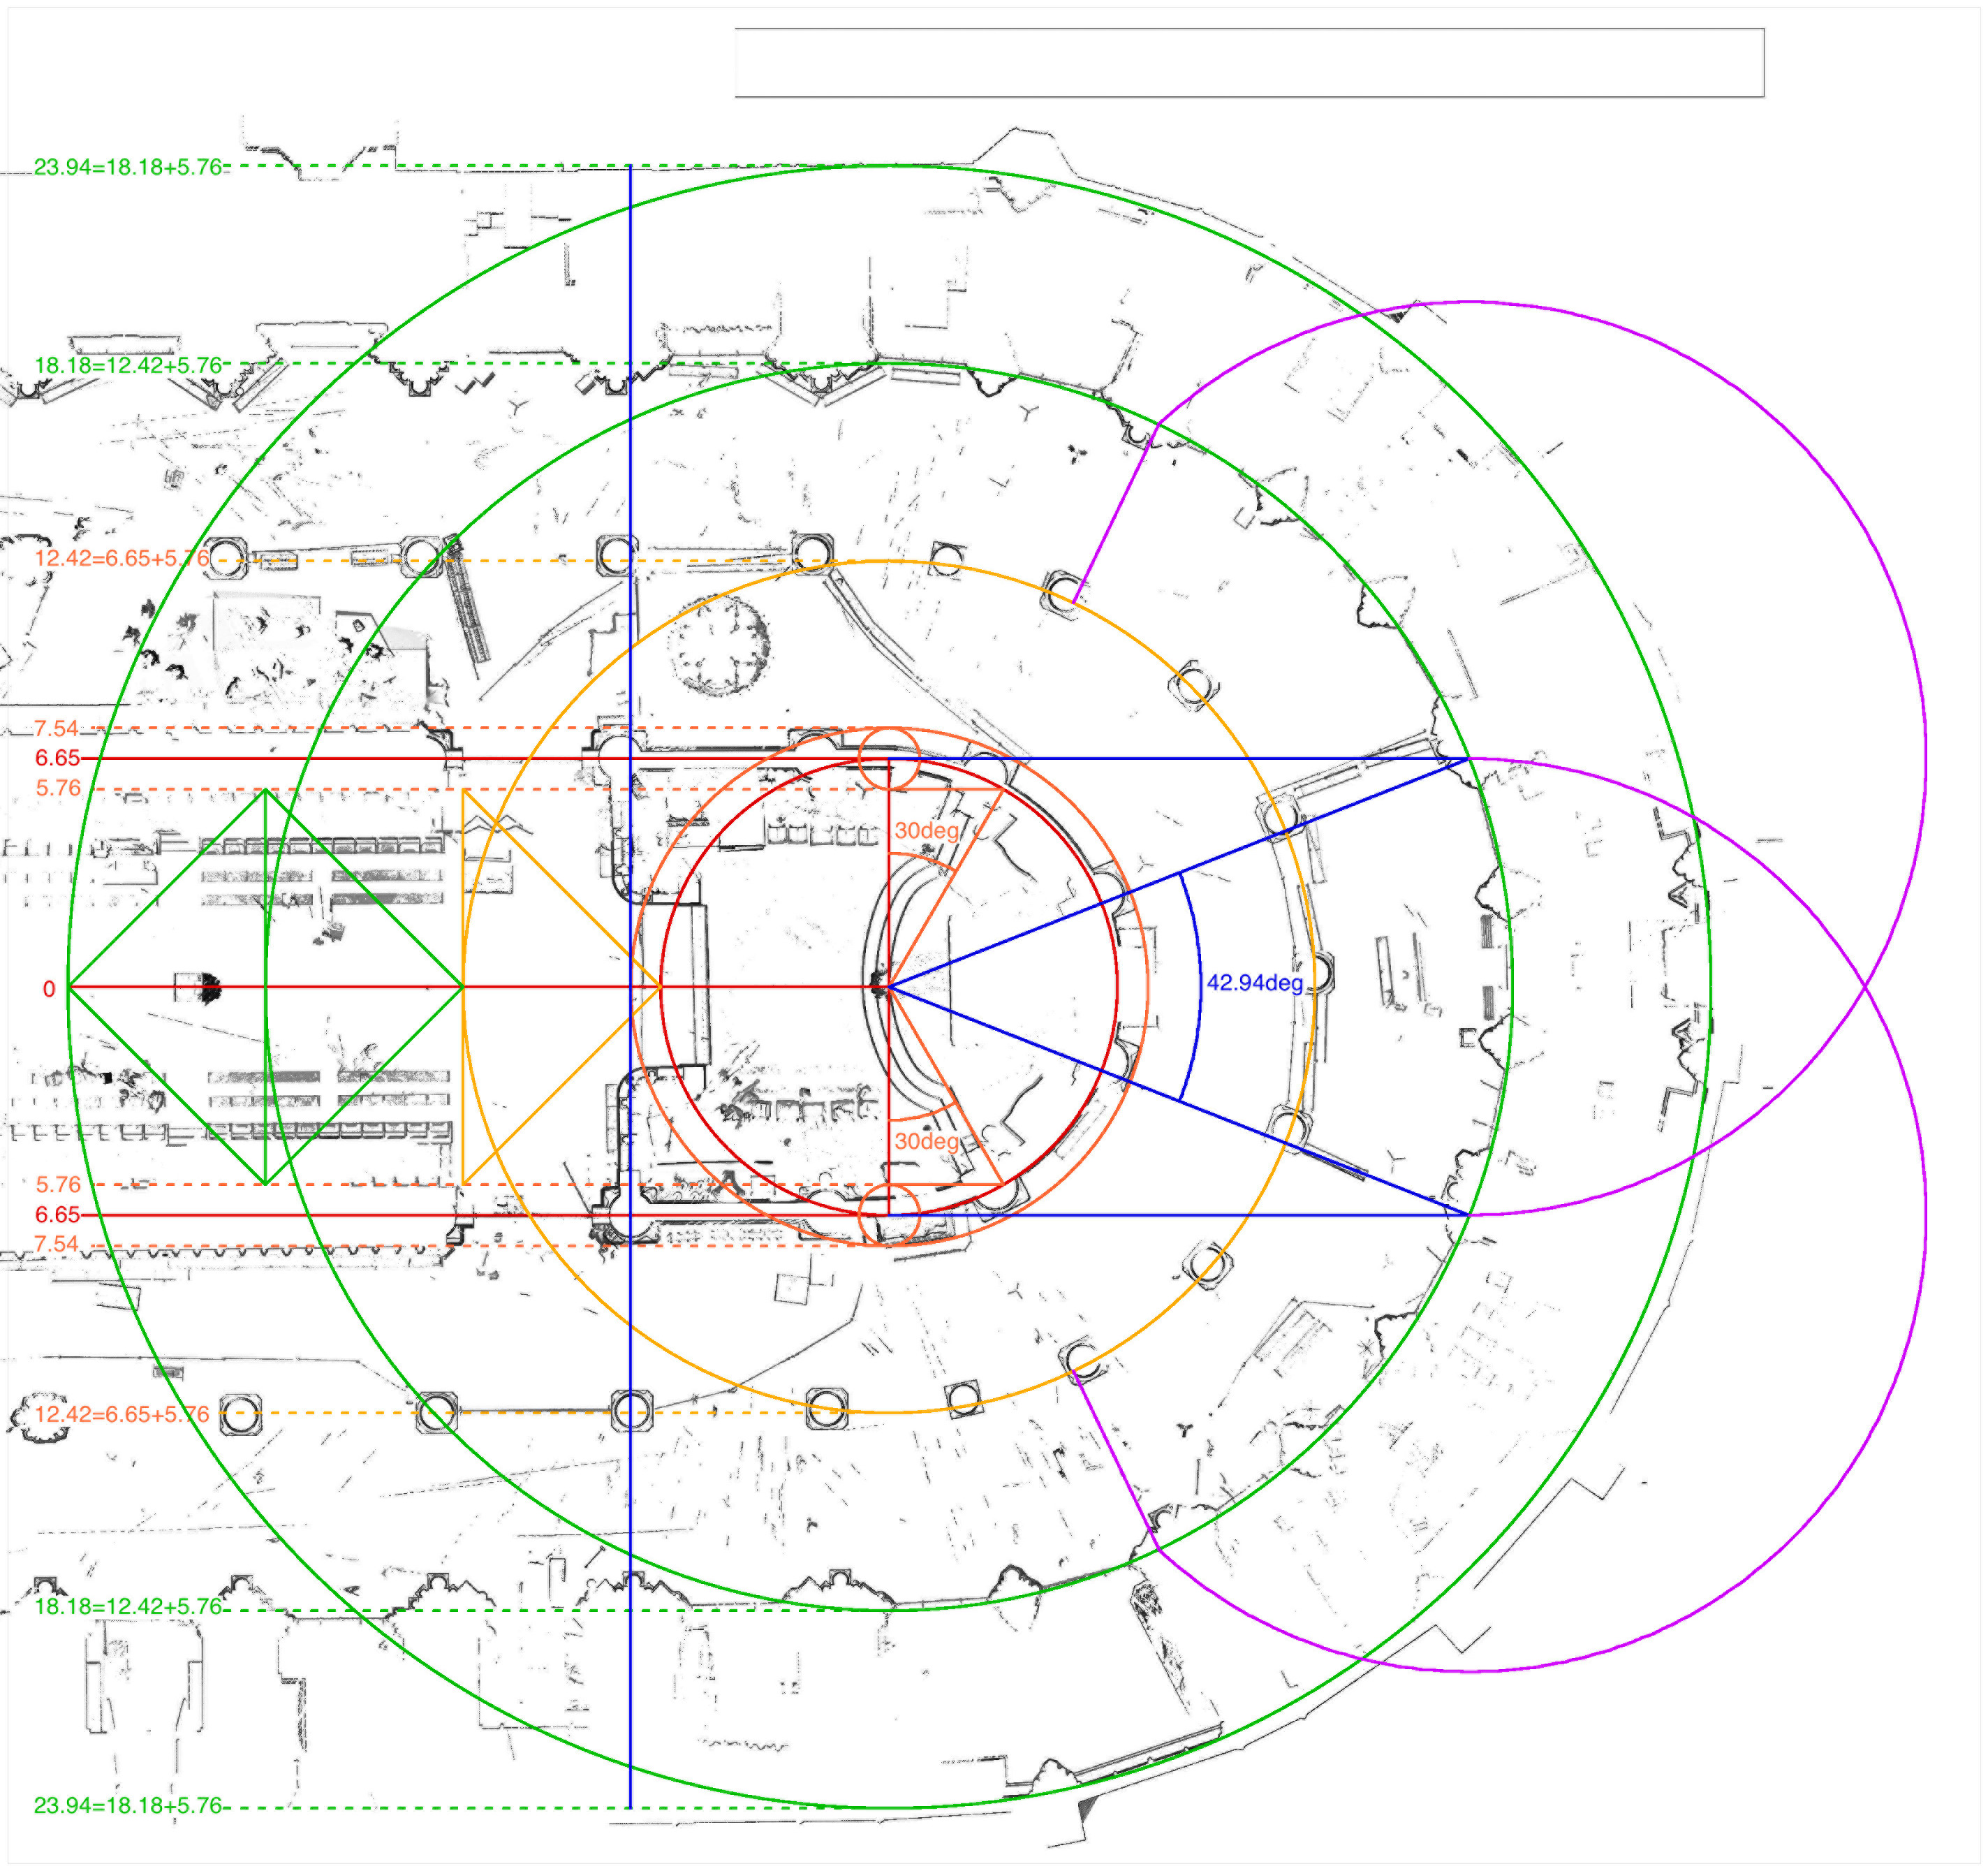
Partial plan of Notre-Dame in Paris, according to laser scan data by Andrew Tallon, showing establishment of chevet wedges adjacent to building axis.

The two main chevet wedges adjacent to the central one have the same angular width; the points describing their boundaries on the outer wall of the ambulatory could thus have been found by simply translating the width of the central wedge, as the violet arcs in the graphic show.

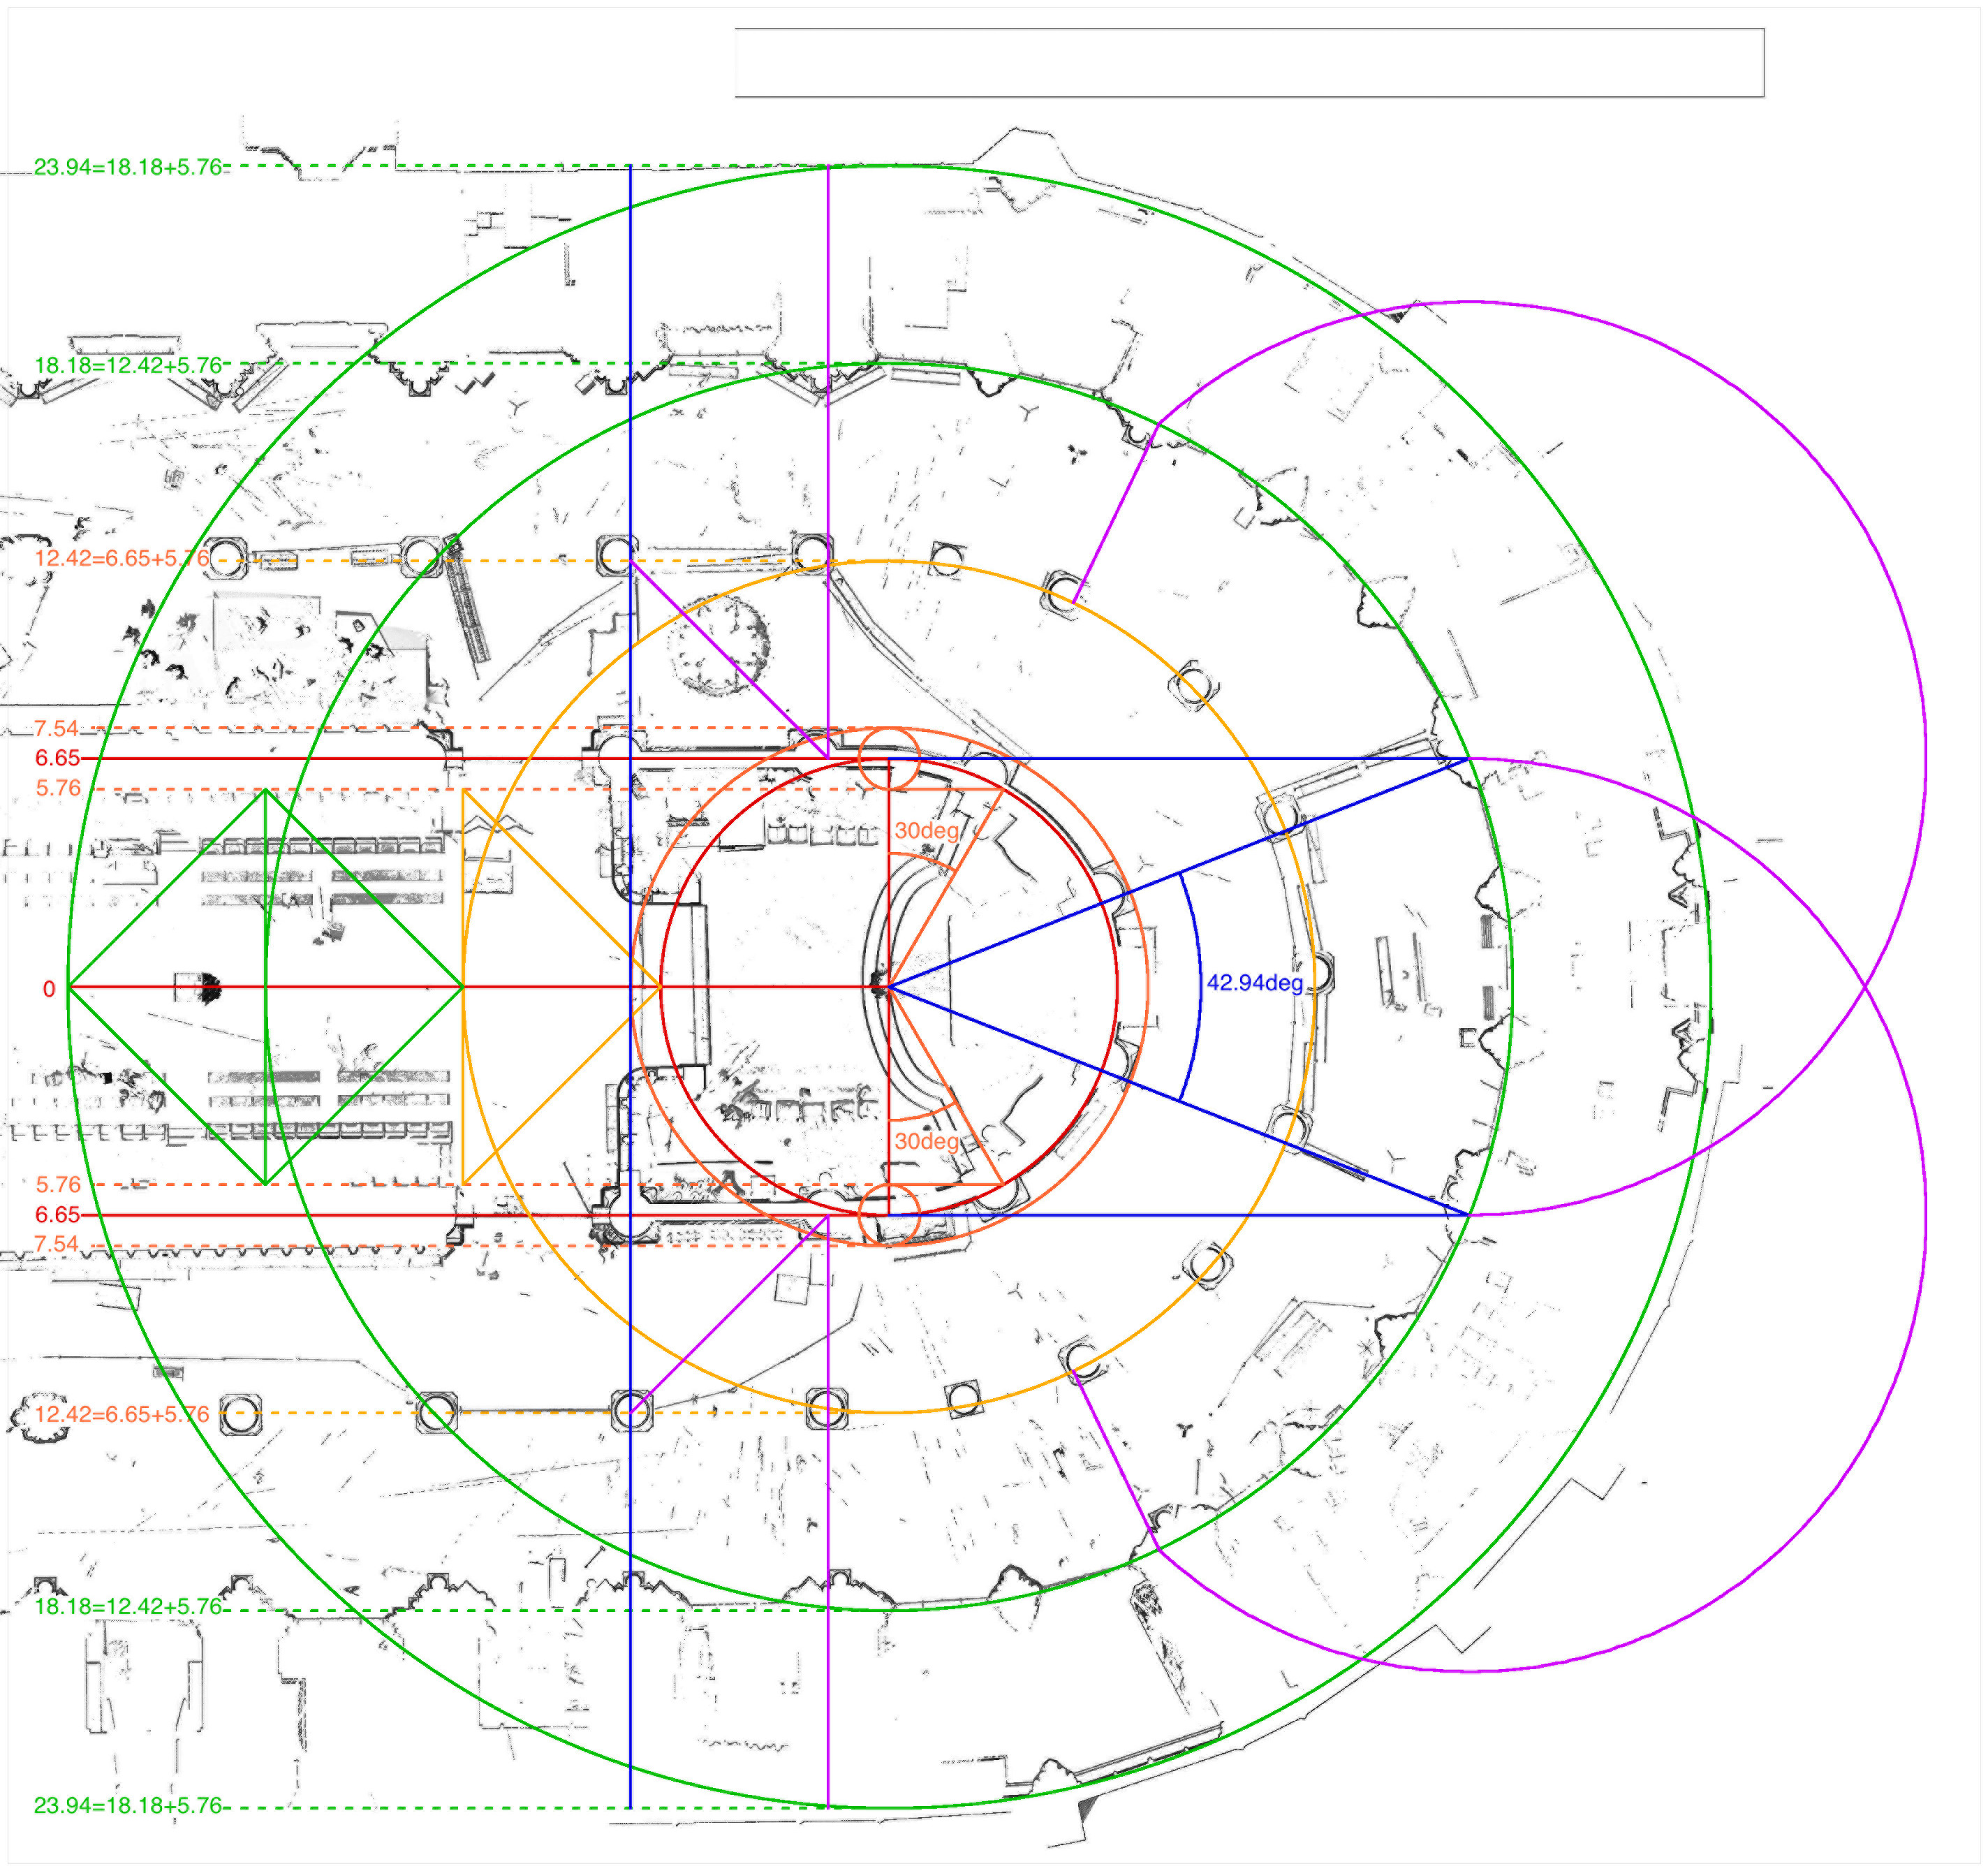
Partial plan of Notre-Dame in Paris, according to laser scan data by Andrew Tallon, showing establishment of first straight bay length.

On the south side of the building, the free-standing columns separating the straight bays from the chevet align quite precisely with the violet vertical in the graphic, which is one aisle width of 5.76m to the east of the blue vertical guideline discussed previously. The corresponding southern wall pier, though, is shifted slightly to the east, while the northern elements seen at the top of the graphic are shifted to the west.

Partial plan of Notre-Dame in Paris, according to laser scan data by Andrew Tallon, showing establishment of second straight bay length.

The same basic pattern is seen in the next straight bay.

Partial plan of Notre-Dame in Paris, according to laser scan data by Andrew Tallon, showing construction of third straight bay length.

Even in the third straight bay of the choir the northern columns and wall piers are displaced to the west of their southern analogs. All of these linear displacements in the straight bays can be understood as resulting from a slight counterclockwise rotation of the chevet geometry, a layout error that would effectively drag any unbuilt southern elements to the east, while pushing the northern elements to the west. This qualitative observation can easily be made more precise.

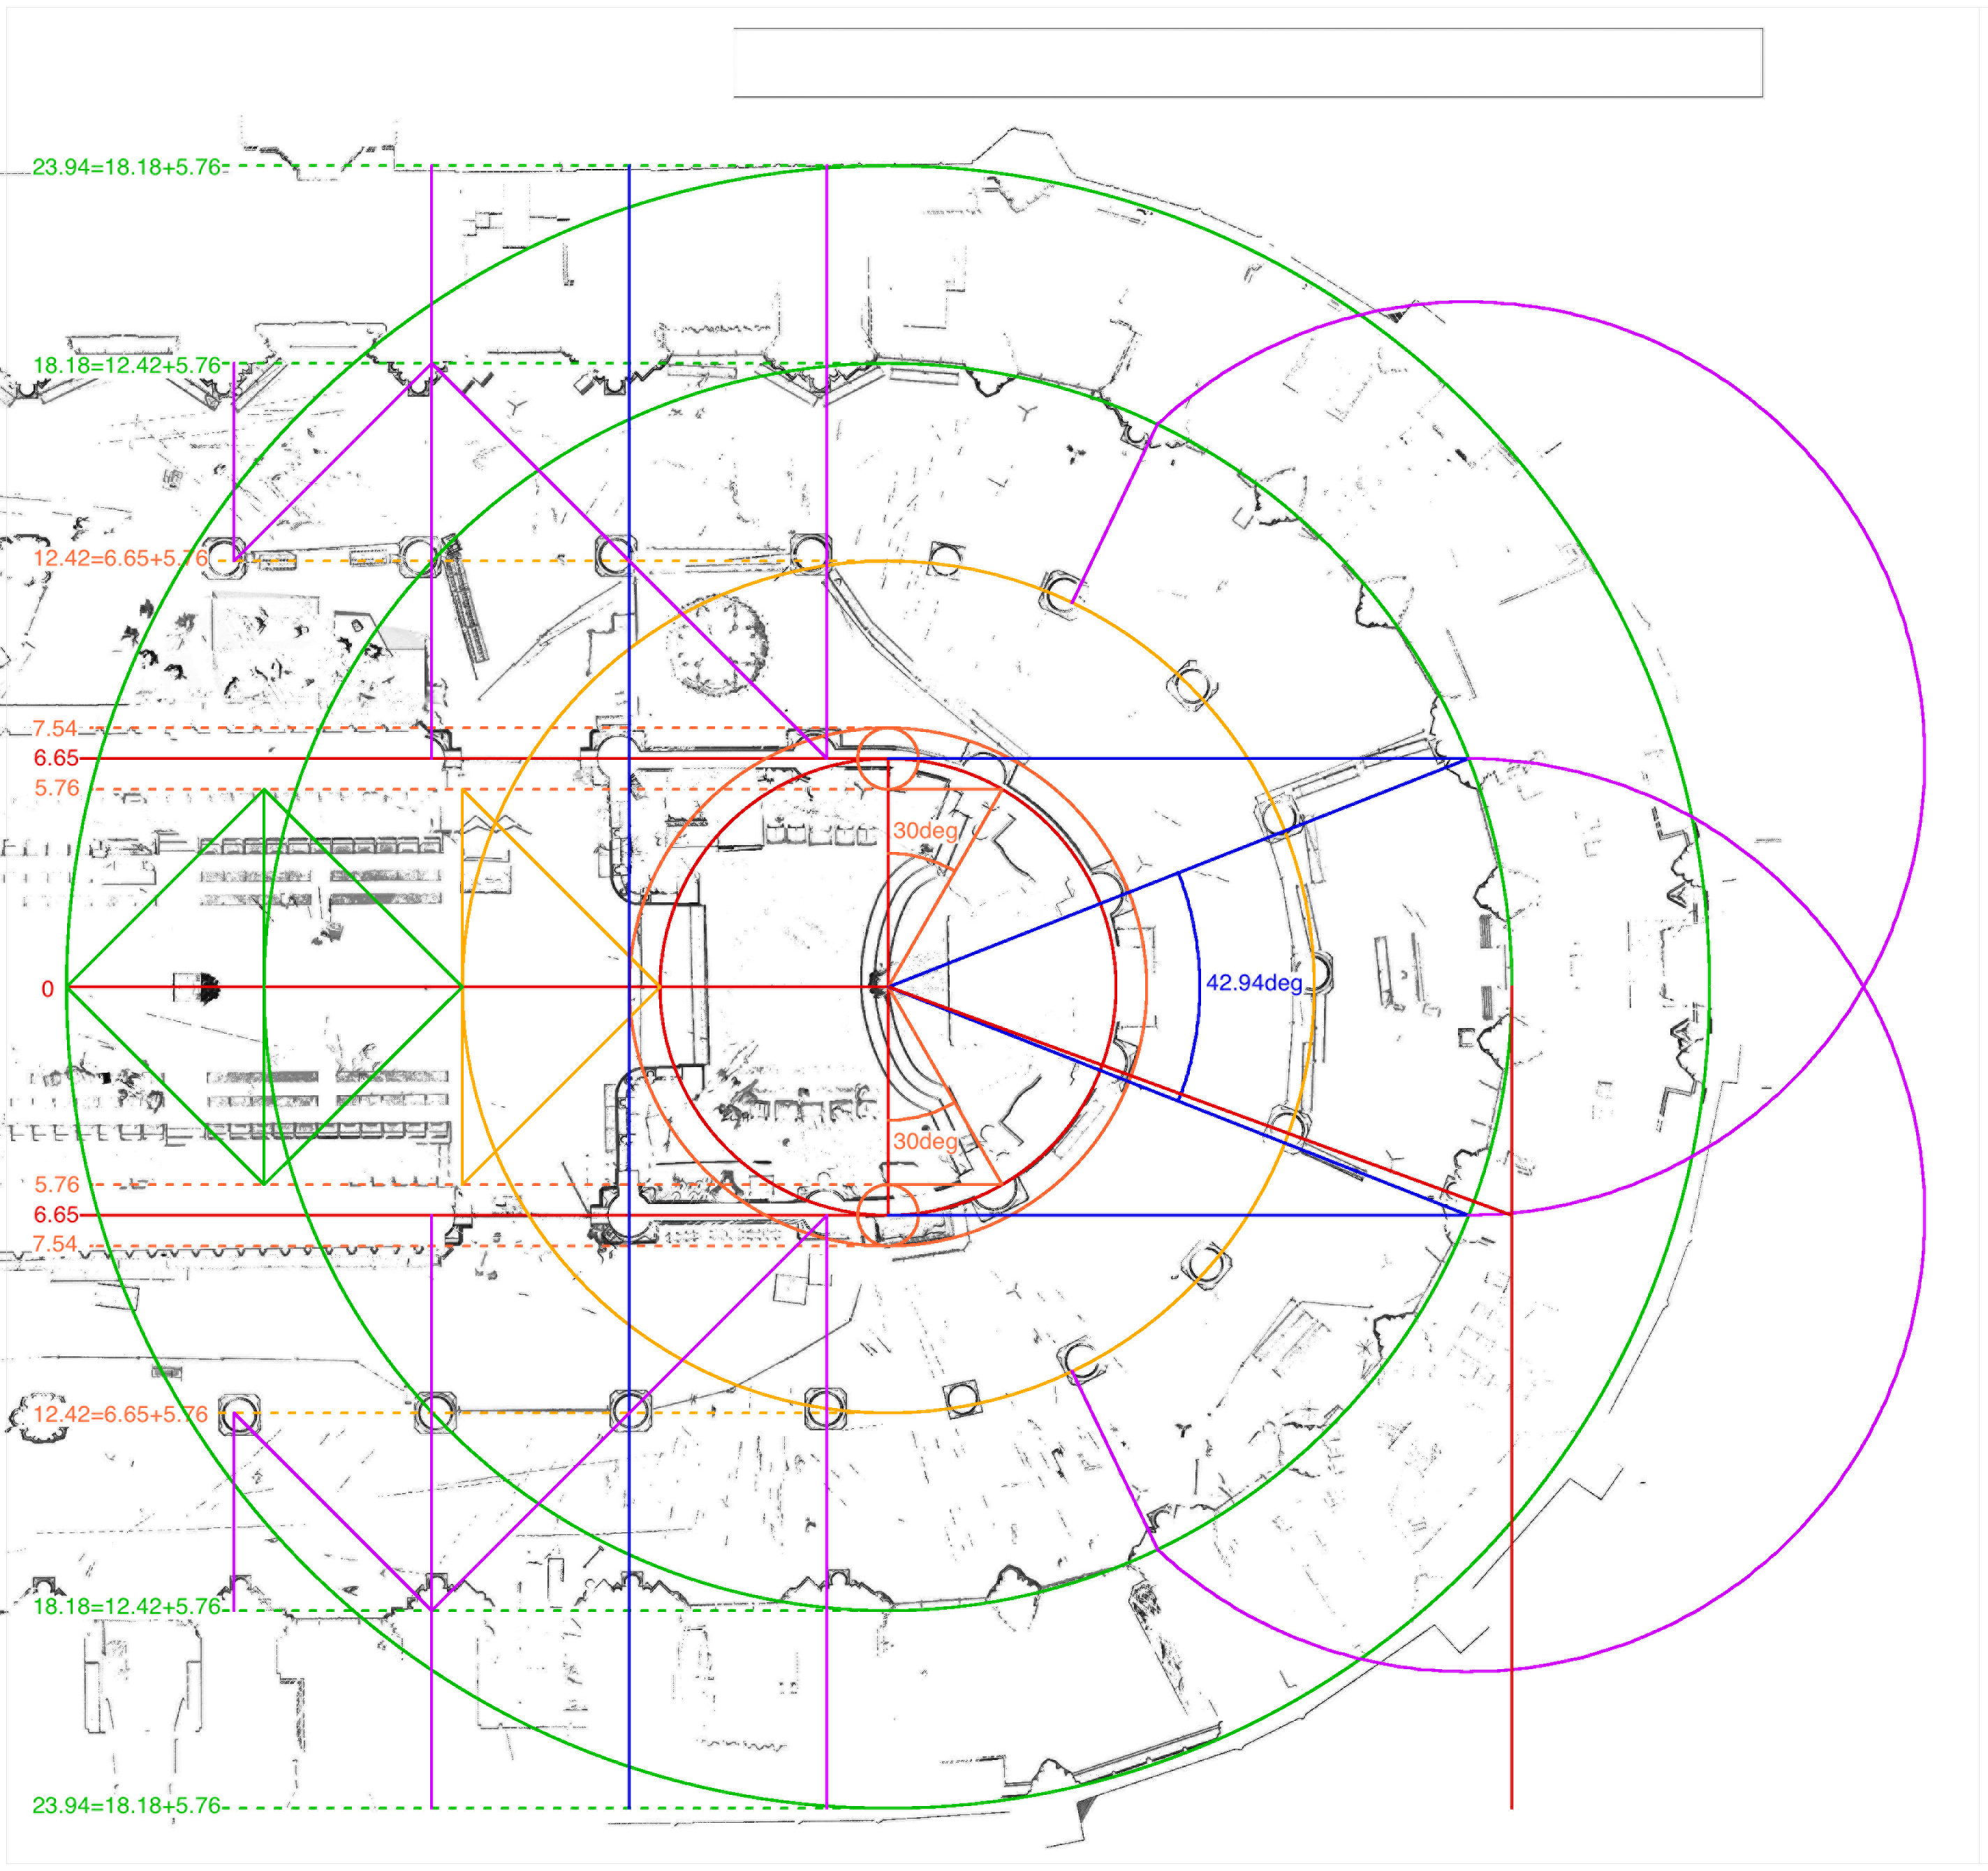
Partial plan of Notre-Dame in Paris, according to laser scan data by Andrew Tallon, showing erroneous use of tangent in construction of central chevet wedge.

It seems that the workers responsible for laying out the east end of Notre-Dame made a slight and readily understandable error: instead of defining the southern margin of the central chevet wedge by connecting the geometrical center to the point where the arcade axis intersects the inner green circle, they evidently sighted to the point where the arcade axis intersects the tangent to that circle, shown here as a red vertical. As a result, the southern edge of the central wedge rotates slightly counterclockwise, from the original blue sloping line to the new red one.

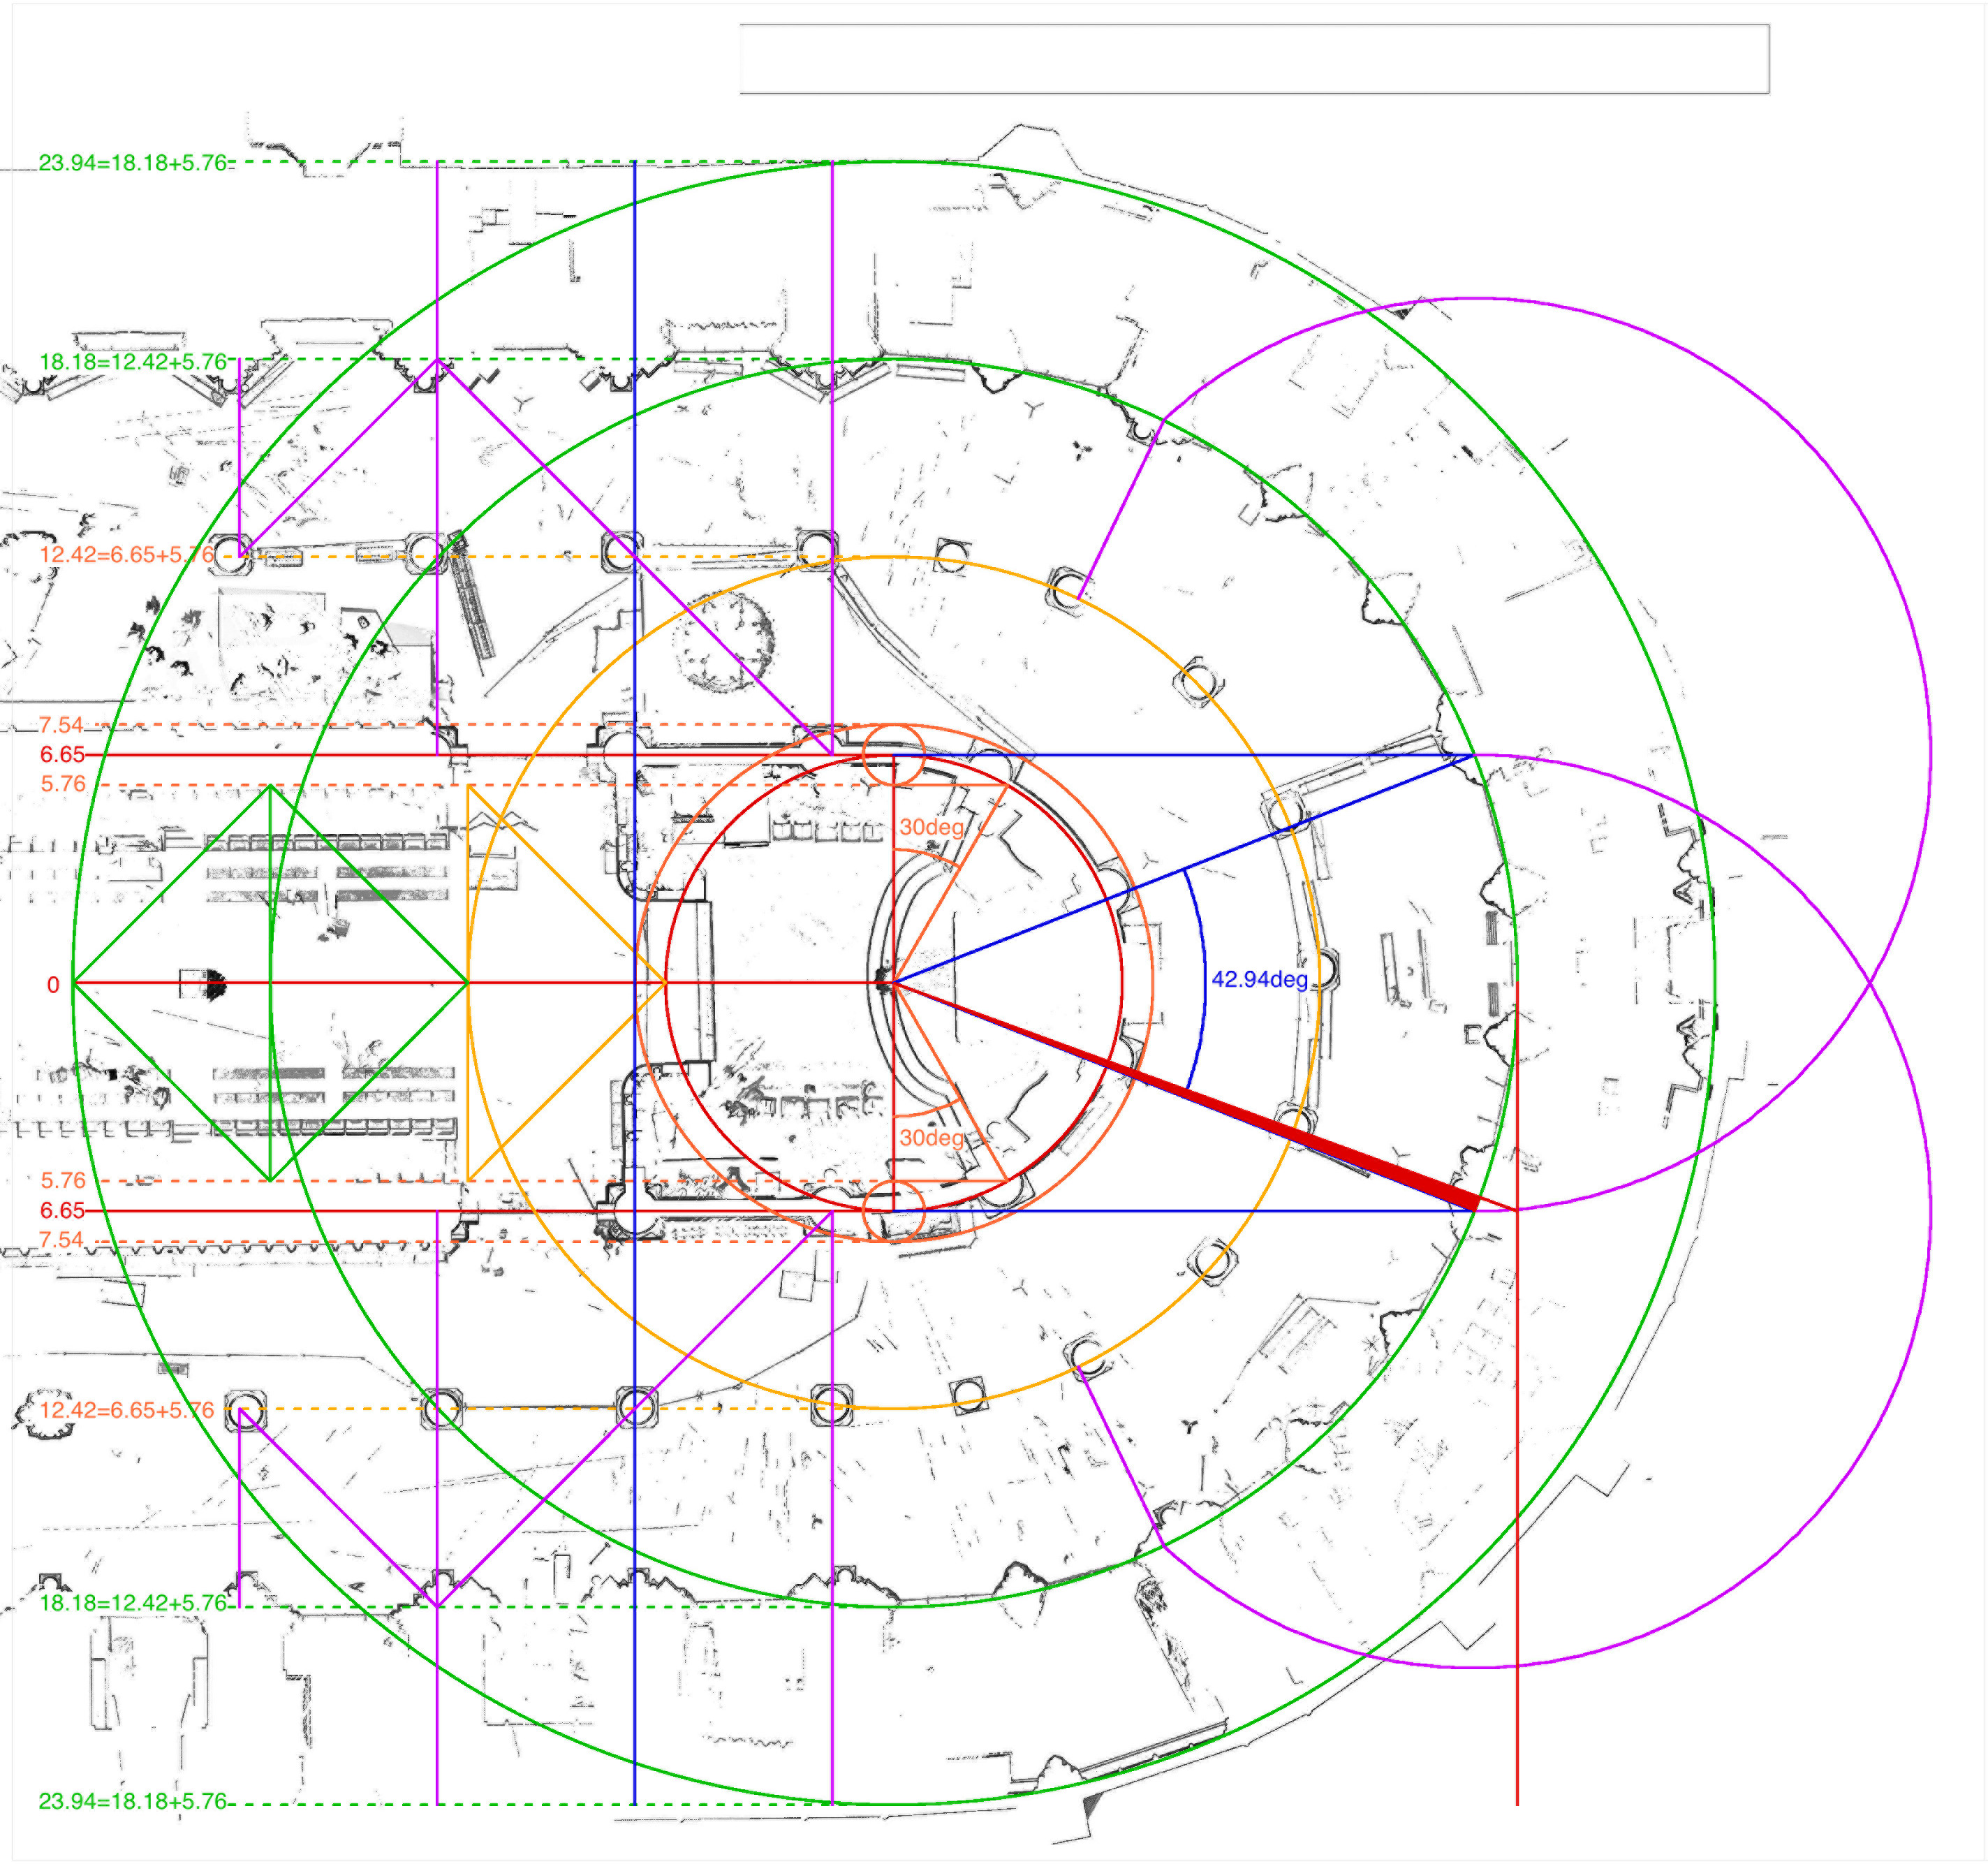
Partial plan of Notre-Dame in Paris, according to laser scan data by Andrew Tallon, showing magnitude of error in construction of central chevet wedge.

The slender red wedge here shows the magnitude of that counterclockwise rotation.

Partial plan of Notre-Dame in Paris, according to laser scan data by Andrew Tallon, showing erroneous counterclockwise rotation of chevet piers.

All of the columns along the original outer perimeter of the chevet appear to have been shifted counterclockwise by the same small displacement, corresponding to the base of that slender red wedge; this dimension corresponds to the radius of the small orange circles at each principal buttress location. The orange radial lines tangent to these small circles give the theoretical location of the slightly displaced buttresses and columns, which agree superbly with their actual locations.

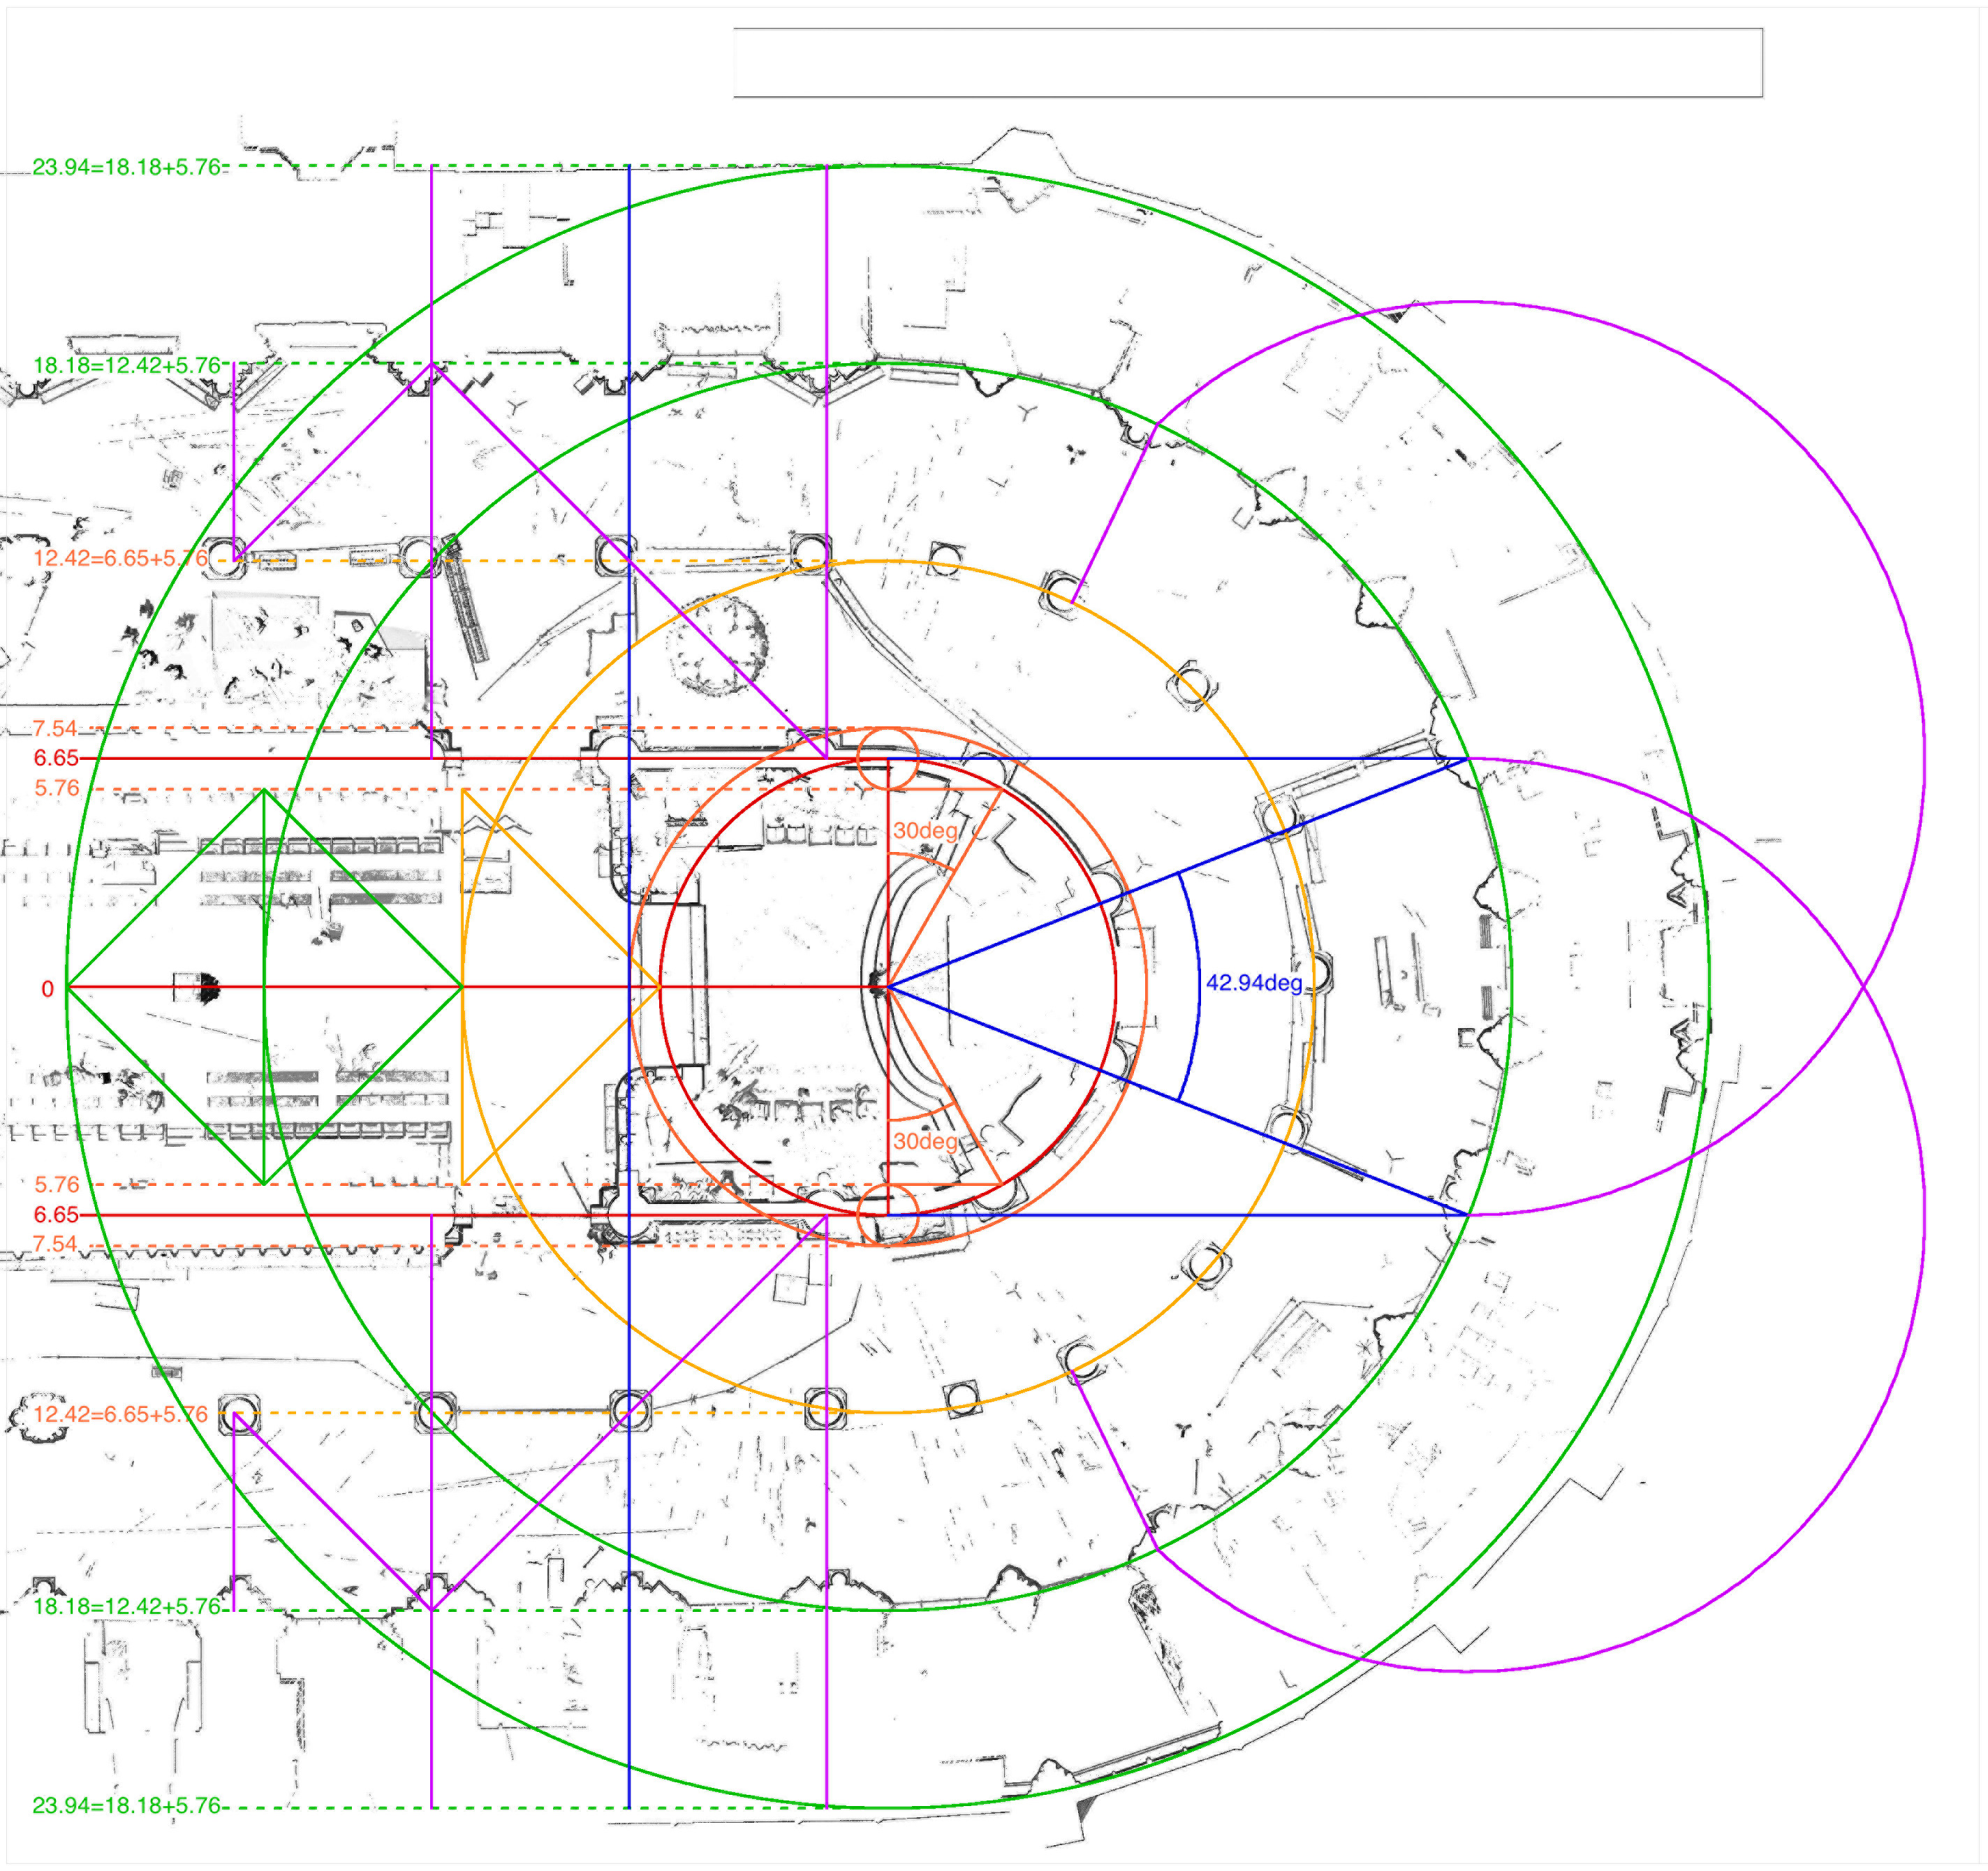
Partial plan of Notre-Dame in Paris, according to laser scan data by Andrew Tallon, showing propagation of error from chevet into north aisle piers.

The same displacement carries into the straight bays of the northern aisles, as the yellow lines near the top of the graphic indicate. The southern freestanding columns, conversely, show no such displacements. This suggests that the southern column locations were established early on in the construction process, before the rotational error was introduced into the layout of the chevet, with the construction of the northern aisle following only afterwards. The geometrical analysis presented here thus offers a potentially valuable perspective on the constructional history of Notre-Dame, as well as on the logic of the cathedral’s overall ground plan design. In broader methodological terms, this analysis demonstrates the fruitful ways in which CAD systems can be used to investigate the highly precise data sets that are now becoming available through laser surveying.